September 14, 2025 a 03:15 am

SW: Trend and Support & Resistance Analysis - Smurfit Westrock Plc
Smurfit Westrock Plc shows a fluctuating trend in its stock market performance over the past months. While there was a prominent increase in stock prices earlier in the year, recent months indicate a more bearish trend. Such volatility can offer opportunities for traders but also poses risks for long-term investors.
Trend Analysis
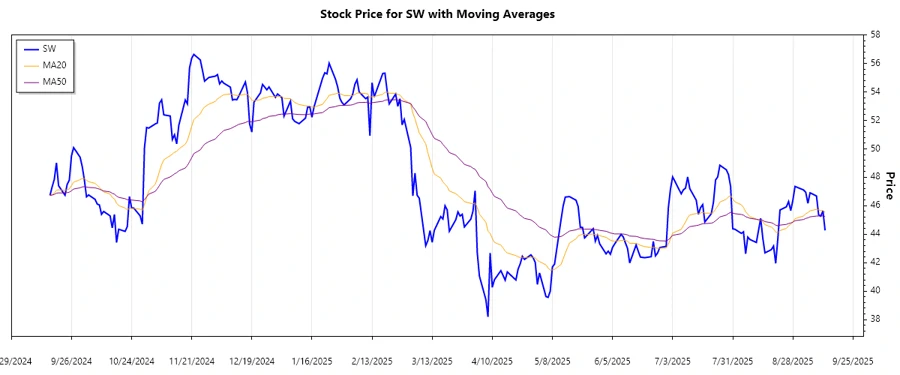
The stock price analysis indicates a predominantly downward trend when observing the EMA calculations. Recent data shows:
| Date | Close Price | Trend |
|---|---|---|
| 2025-09-12 | 44.27 | ▼ Downtrend |
| 2025-09-11 | 45.64 | ▼ Downtrend |
| 2025-09-10 | 45.27 | ▼ Downtrend |
| 2025-09-09 | 45.36 | ▼ Downtrend |
| 2025-09-08 | 46.69 | ▼ Downtrend |
| 2025-09-05 | 46.91 | ▼ Downtrend |
| 2025-09-04 | 46.17 | ▼ Downtrend |
This downward trend, indicated by the fact that EMA20 is consistently below EMA50, suggests a bearish market sentiment which might result in continued negative performance if external factors remain unchanged.
Support- and Resistance
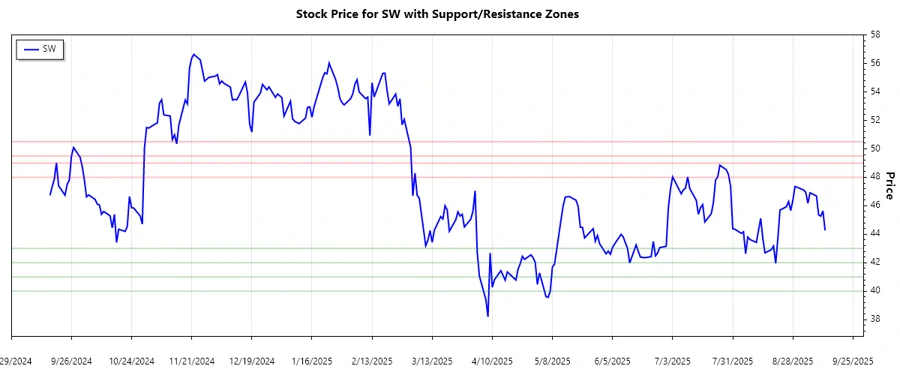
Based on the latest price actions, the following support and resistance zones are observed:
| Zone Type | From | To |
|---|---|---|
| Support | 42.00 | 43.00 |
| Support | 40.00 | 41.00 |
| Resistance | 48.00 | 49.00 |
| Resistance | 49.50 | 50.50 |
Currently, the stock price is hovering near the support zone of 42.00 to 43.00, suggesting potential consolidation before possibly retesting this zone. Persistent trading below this level may trigger further declines.
Conclusion
Overall, Smurfit Westrock Plc exhibits a challenging market environment with prevailing downward momentum. While the technical indicators suggest caution, potential supports might provide buying opportunities for tactical investors. However, breaking through significant support levels could lead to increased bearish pressure. Analysts must consider external economic factors and market trends to formulate comprehensive strategies moving forward.