April 27, 2026 a 07:30 am

SW: Dividend Analysis - Smurfit Westrock Plc
The analysis of Smurfit Westrock Plc's dividend profile reveals a moderate yield with recent growth challenges. With over a decade of consistent payouts but a declining growth trend, investors could consider its stability but should be cautious of the high payout ratio. Financial robustness needs to be carefully evaluated with regard to future dividend sustainability.
📊 Overview
Smurfit Westrock Plc operates in the diverse sector, with a current dividend yield of 3.43%, offering a return that aligns with market averages. The recent history reflects a maintained dividend for 13 years. Last suspension remains unreported, indicating consistency.
| Parameter | Value |
|---|---|
| Sector | Industrial |
| Dividend yield | 3.43% |
| Current dividend per share | 1.50 USD |
| Dividend history | 13 years |
| Last cut or suspension | None |
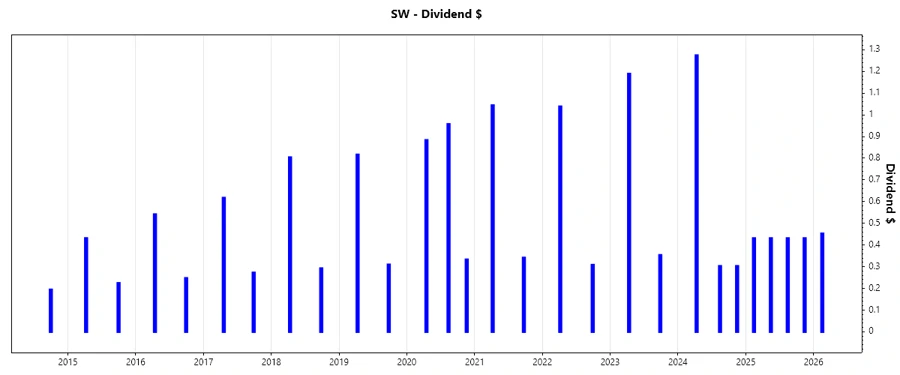
📈 Dividend History
A consistent dividend payment pattern is crucial for assessing company stability and investor confidence. Historical payouts reflect the company’s financial management and resilience during market fluctuations.
| Year | Dividend Per Share (USD) |
|---|---|
| 2026 | 0.4523 |
| 2025 | 1.7232 |
| 2024 | 1.87874 |
| 2023 | 1.54172 |
| 2022 | 1.34598 |
📉 Dividend Growth
Dividend growth is a key indicator of a company's earnings potential and management's confidence in future cash flows. Recent data reflects fluctuations that merit investor scrutiny.
| Time | Growth |
|---|---|
| 3 years | 8.58% |
| 5 years | -4.53% |
The average dividend growth is -4.53% over 5 years. This shows moderate but steady dividend growth.
✅ Payout Ratio
A pivotal measure in dividend sustainability, the payout ratio indicates the proportion of earnings distributed as dividends. A high ratio may hint at potential risks in maintaining current dividend levels.
| Key figure | Ratio |
|---|---|
| EPS-based | 109.59% |
| Free cash flow-based | 64.99% |
The payout ratio suggests that dividends exceed earnings, indicating potential unsustainable practices unless accompanied by robust cash flow management.
📊 Cashflow & Capital Efficiency
Evaluating free cash flow and capital efficiency underscores the company’s ability to sustain dividends and invest for growth. Key indicators provide insights into operational robustness. Variability in cash flow indicates monitoring necessity for long-term stability.
| Year | 2025 | 2024 | 2023 |
|---|---|---|---|
| Free Cash Flow Yield | 6.08% | 0.08% | 6.46% |
| Earnings Yield | 3.93% | 1.48% | 7.66% |
| CAPEX to Operating Cash Flow | 64.32% | 98.85% | 59.59% |
| Stock-based Compensation to Revenue | 0.00% | 1.01% | 0.60% |
| Free Cash Flow / Operating Cash Flow Ratio | 35.38% | 1.15% | 40.41% |
The data reflects significant fluctuation in cash flow generation, warranting careful watch on future CAPEX efficiency and stock compensation practices.
🗣️ Balance Sheet & Leverage Analysis
Considers the risk profile and long-term financial health by analyzing debt ratios and liquidity. Deterioration may indicate slowed growth or potential financial strain.
| Year | 2025 | 2024 | 2023 |
|---|---|---|---|
| Debt-to-Equity | 0.69 | 0.78 | 0.67 |
| Debt-to-Assets | 0.28 | 0.31 | 0.29 |
| Debt-to-Capital | 0.41 | 0.44 | 0.40 |
| Net Debt to EBITDA | 3.01 | 4.64 | 1.74 |
| Current Ratio | 1.48 | 0.00 | 1.52 |
| Quick Ratio | 1.03 | 0.89 | 1.12 |
| Financial Leverage | 2.46 | 2.52 | 2.28 |
The numbers indicate reasonable debt management, albeit high leverage relative to peers, potentially posing risks under adverse conditions.
🗣️ Fundamental Strength & Profitability
Key profitability metrics and operational efficiency underpins competitive positioning and strategic adaptability.
| Year | 2025 | 2024 | 2023 |
|---|---|---|---|
| Return on Equity | 3.60% | 1.77% | 12.14% |
| Return on Assets | 1.46% | 0.70% | 5.32% |
| Margins: Net | 2.33% | 1.51% | 6.82% |
| Margins: EBIT | 5.66% | 6.53% | 11.59% |
| Margins: EBITDA | 13.83% | 13.46% | 16.38% |
| Margins: Gross | 19.42% | 19.87% | 25.25% |
| Research & Development to Revenue | 0.00% | 0.00% | 0.00% |
The robust growth seen in ROE and margins points to strong profitability, but stagnant R&D investment could limit long-term innovation capacity.
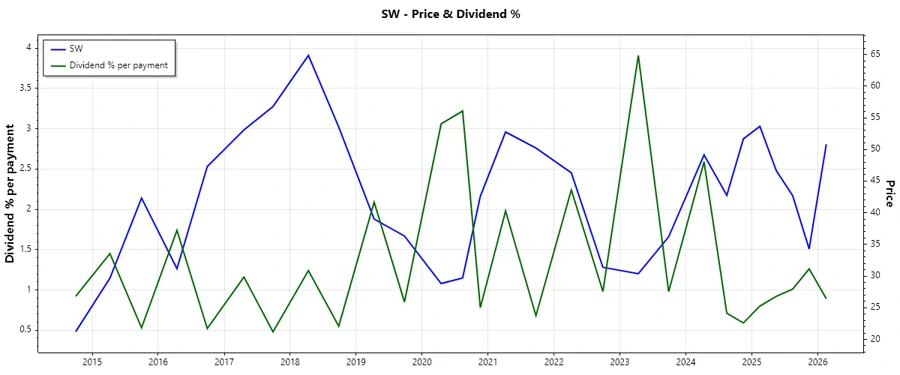
📈 Price Development
📊 Dividend Scoring System
| Category | Score | Score Bar |
|---|---|---|
| Dividend yield | 3 | |
| Dividend stability | 4 | |
| Dividend growth | 2 | |
| Payout ratio | 2 | |
| Financial stability | 3 | |
| Dividend continuity | 4 | |
| Cashflow Coverage | 3 | |
| Balance Sheet Quality | 3 |
Overall Score: 24/40
✅ Rating
Smurfit Westrock Plc's dividend profile carries a medium-risk rating, with strong points in stability and dividend continuity. However, caution is advised due to potential financial strain reflected in high payout levels. Investors seeking income might find value, but should remain vigilant to underlying cash flow and balance sheet dynamics.