November 02, 2025 a 03:31 pm

SW: Dividend Analysis - Smurfit Westrock Plc
📊 Smurfit Westrock Plc has established itself as a robust player in the packaging sector, with a focus on reliable and consistent dividend payouts, as illustrated by its current yield. The company's comprehensive dividend strategy, despite its high EPS-based payout ratio, underscores potential for sustainable returns to shareholders.
Overview
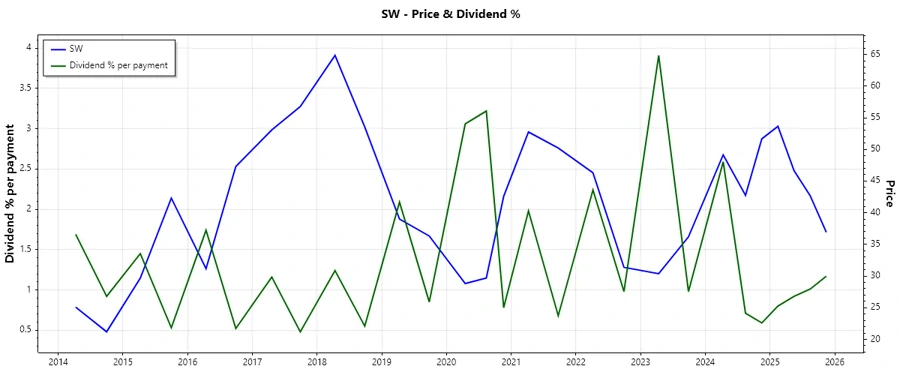
Smurfit Westrock Plc belongs to the packaging sector, a critical industry component known for its resilience in economic cycles. The company currently offers a dividend yield of 4.67%, with a current dividend per share of USD 1.68. This reflects a consistent dividend history of 12 years with minimal interruptions, reinforcing investor confidence in the company’s commitment to shareholder returns.
| Indicator | Value |
|---|---|
| Sector | Packaging |
| Dividend Yield | 4.67% |
| Current Dividend Per Share | 1.68 USD |
| Dividend History | 12 years |
| Last Cut or Suspension | None |
Dividend History
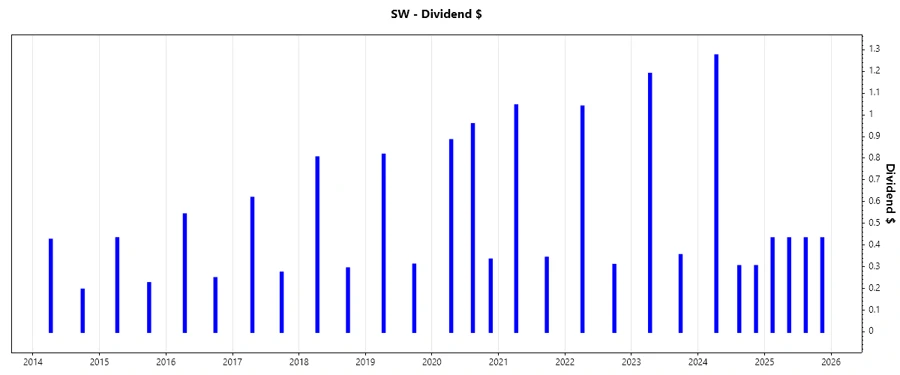
Understanding the dividend history is crucial as it highlights Smurfit Westrock Plc's commitment to shareholder returns through various economic cycles. Their consistent dividend payments indicate financial stability and management's dedication to rewarding investors.
| Year | Dividend Per Share (USD) |
|---|---|
| 2025 | 1.7232 |
| 2024 | 1.87874 |
| 2023 | 1.54172 |
| 2022 | 1.34598 |
| 2021 | 1.38429 |
Dividend Growth
The dividend growth of Smurfit Westrock Plc highlights the company’s capacity to enhance shareholder value consistently. The past 3-year growth at 10.72% and 5-year growth at 10.79% underscore a pattern of moderate, stable increases, reinforcing expectations for continued future appreciation.
| Time | Growth |
|---|---|
| 3 years | 10.72% |
| 5 years | 10.79% |
🔍 The average dividend growth is 10.79% over 5 years. This shows moderate but steady dividend growth, which indicates positive management actions towards enhancing shareholder returns.
Payout Ratio
Smurfit Westrock Plc's payout ratio provides insight into how the company allocates its earnings. An EPS-based payout ratio of 249.72% illustrates potential sustainability concerns if unchecked, while a free cash flow-based ratio of 1034.38% points toward potential cash flow management strategies to ensure dividend commitments.
| Key Figure | Ratio |
|---|---|
| EPS-based | 249.72% |
| Free Cash Flow-based | 1034.38% |
⚠️ These ratios indicate that while dividends are currently maintained, there are significant pressures to balance commitments without impacting financial stability.
Cashflow & Capital Efficiency
The cash flow and capital efficiency metrics of Smurfit Westrock Plc highlight operational effectiveness vital for sustaining dividends and investing in future growth. Figures such as Free Cash Flow Yield and Capex to Operating Cash Flow reveal the company’s financial resilience and strategic capital deployment.
| Year | 2024 | 2023 | 2022 |
|---|---|---|---|
| Free Cash Flow Yield | 0.08% | 7.46% | 5.94% |
| Earnings Yield | 1.48% | 7.66% | 11.40% |
| CAPEX to Operating Cash Flow | 98.85% | 60.91% | 64.90% |
| Stock-based Compensation to Revenue | 1.01% | 0.62% | 0.52% |
| Free Cash Flow / Operating Cash Flow Ratio | 1.15% | 46.66% | 35.10% |
🗣️ The company demonstrates strong capital efficiency, yet high CAPEX and reliance on stock-based compensation reflect strategic reinvestment decisions aimed at sustained growth.
Balance Sheet & Leverage Analysis
Smurfit Westrock Plc's balance sheet highlights its financial structure and leverage. Ratios like Debt-to-Equity and Current Ratio reflect the company’s liquidity position and debt management strategy, crucial for maintaining operational flexibility and economic resilience.
| Year | 2024 | 2023 | 2022 |
|---|---|---|---|
| Debt-to-Equity | 78.31% | 60.82% | 70.15% |
| Debt-to-Assets | 31.07% | 26.83% | 30.28% |
| Debt-to-Capital | 43.92% | 37.82% | 41.23% |
| Net Debt to EBITDA | 4.64x | 1.54x | 1.38x |
| Current Ratio | 1.37 | 1.52 | 1.60 |
| Quick Ratio | 0.89 | 1.14 | 1.18 |
| Financial Leverage | 2.52 | 2.27 | 2.32 |
✅ The analysis reflects a stable financial footing, with strategic leveraging facilitating operational and growth initiatives, while maintaining sufficient liquidity.
Fundamental Strength & Profitability
The profitability and fundamental strength of Smurfit Westrock Plc, as indicated by metrics such as ROE, ROA, and various margin figures, are pivotal in assessing the efficiency and market positioning of the company.
| Year | 2024 | 2023 | 2022 |
|---|---|---|---|
| Return on Equity | 1.77% | 12.14% | 17.92% |
| Return on Assets | 0.70% | 5.35% | 7.74% |
| Net Profit Margin | 1.51% | 6.82% | 7.65% |
| EBIT Margin | 6.53% | 11.59% | 12.74% |
| EBITDA Margin | 13.46% | 16.38% | 16.91% |
| Gross Margin | 19.87% | 25.25% | 24.22% |
| Research & Development to Revenue | 0% | 0% | 0% |
📈 The company has shown robust efficiency and margin performance that suggest solid market positioning and effective cost management, albeit with zero R&D investment highlighting a potential area for strategic focus.
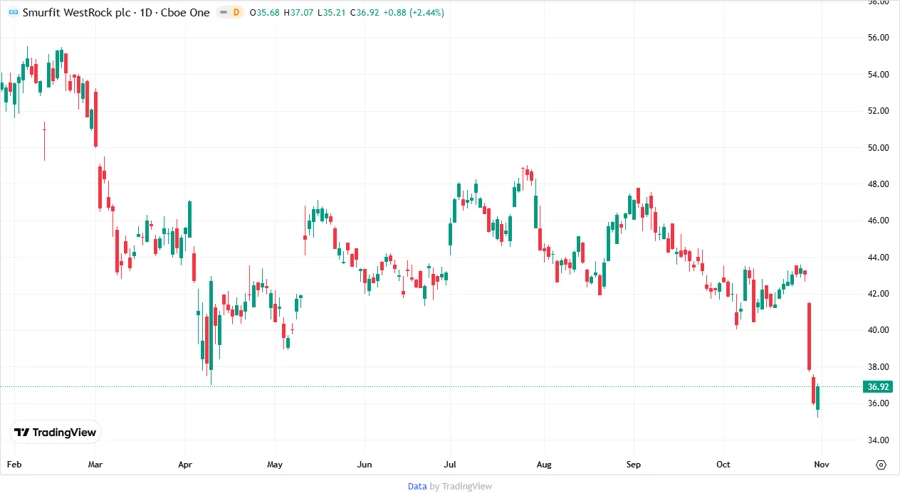
Price Development
Dividend Scoring System
| Criteria | Score | |
|---|---|---|
| Dividend yield | 4 | |
| Dividend Stability | 4 | |
| Dividend growth | 4 | |
| Payout ratio | 2 | |
| Financial stability | 3 | |
| Dividend continuity | 5 | |
| Cashflow Coverage | 2 | |
| Balance Sheet Quality | 4 |
Total Score: 28/40
Rating
Smurfit Westrock Plc presents a compelling dividend profile with a strong yield and consistent growth. However, the high payout ratios warrant attention for future cash flow strategies. Overall, this stock represents a balanced option for dividend-focused portfolios, with room for growth in financial and operational strategies.
Smart Data Insight
Master the Perfect Entry & Exit for this Stock
Don't leave your profits to chance. Historically, this stock follows specific seasonal patterns that institutional traders use to maximize returns.
- ✅ Identify the "Golden Buying Window"
- ✅ Avoid high-risk correction cycles
- ✅ Backtested data from the last 20+ years