
July 27, 2026 a 08:15 am
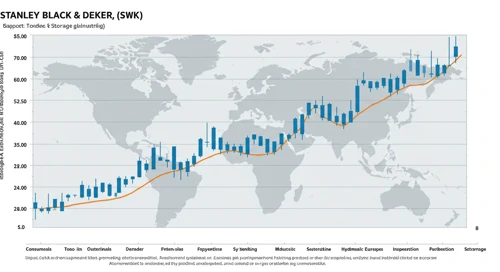


SWK: Trend and Support & Resistance Analysis - Stanley Black & Decker, Inc.
The analysis of Stanley Black & Decker, Inc. indicates a recent moderate upward trend. The company's solid footing in the Tools & Storage and Industrial sectors positions it positively in the current market environment. With an extensive global reach, their diversified product offerings shield them from localized economic fluctuations. However, the ongoing volatility in the market, especially in sectors tied closely to construction and industry, presents ongoing risks. It's crucial for investors to watch the support and resistance levels identified in this analysis.
Trend Analysis
| Date | Closing Price | Trend |
|---|---|---|
| 2026-07-24 | 91.26 | ▲ |
| 2026-07-23 | 87.41 | ▼ |
| 2026-07-22 | 89.25 | ▲ |
| 2026-07-21 | 88.19 | ▼ |
| 2026-07-20 | 87.50 | ▼ |
| 2026-07-17 | 90.17 | ▲ |
| 2026-07-16 | 91.31 | ▲ |
The trend shows alternating highs and lows, indicative of market indecision but with a slight upward bias. The EMA20 surpassing EMA50 in recent days confirms a potential ascent in the short term.
Support and Resistance
| Zone Type | Price Range |
|---|---|
| Support | 84.00 - 85.50 ▼ |
| Support | 87.00 - 88.00 ▼ |
| Resistance | 92.50 - 93.50 ▲ |
| Resistance | 95.00 - 96.00 ▲ |
Currently, the stock is approaching the lower resistance zone, which might prove challenging given existing market conditions. Successful breaches of these levels could open pathways to higher resistance targets.
Conclusion
The current analysis of Stanley Black & Decker's stock reveals mixed signals with a gentle upward trajectory. With the EMA indicators suggesting rising momentum, the stock could potentially break past its immediate resistance levels. However, market volatility and economic conditions must be considered, presenting both challenges and opportunities for investors. Analysts should closely monitor for signs of a sustained breakout or pullback to support levels for optimal decision-making.
Smart Data Insight
Master the Perfect Entry & Exit for this Stock
Don't leave your profits to chance. Historically, this stock follows specific seasonal patterns that institutional traders use to maximize returns.
- ✅ Identify the "Golden Buying Window"
- ✅ Avoid high-risk correction cycles
- ✅ Backtested data from the last 20+ years