August 31, 2025 a 09:03 am

SWK: Trend and Support & Resistance Analysis - Stanley Black & Decker, Inc.
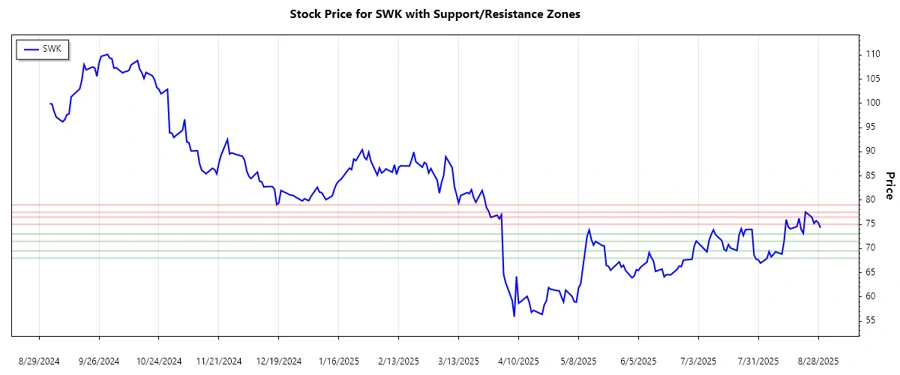
The analysis of Stanley Black & Decker, Inc.'s stock performance shows some key trends and patterns over the analyzed period. Understanding these trends can provide insights into potential future performance. Let's delve deeper into the trend analysis and support-resistance zones to gauge investor sentiment and technical positioning.
Trend Analysis
The exponential moving averages (EMAs) provide insights into the recent price trend of Stanley Black & Decker, Inc. By comparing the 20-day EMA to the 50-day EMA, we can infer the stock trend: uptrend, downtrend, or sideways movement.
| Date | Closing Price | Trend |
|---|---|---|
| 2025-08-29 | 74.29 | ▼ Downward |
| 2025-08-28 | 75.30 | ▲ Upward |
| 2025-08-27 | 75.74 | ▲ Upward |
| 2025-08-26 | 75.19 | ▼ Downward |
| 2025-08-25 | 76.47 | ▲ Upward |
| 2025-08-22 | 77.53 | ▲ Upward |
| 2025-08-21 | 73.13 | ▼ Downward |
Based on the EMA comparison, the trend indicates a predominantly upward movement, although some volatility is present. The recent crossover of the EMA20 over EMA50 shows potential support for upward momentum.
Support and Resistance
Identifying support and resistance levels helps in understanding price levels where the momentum could potentially change. Here are calculated support and resistance zones.
| Zone Type | Lower Bound | Upper Bound |
|---|---|---|
| Support Zone 1 | ▲ 71.50 | ▲ 73.00 |
| Support Zone 2 | ▲ 68.00 | ▲ 69.50 |
| Resistance Zone 1 | ▼ 75.00 | ▼ 76.50 |
| Resistance Zone 2 | ▼ 77.50 | ▼ 79.00 |
Currently, the stock is situated near a support zone, suggesting limited downside potential unless breached significantly. The 75-76.50 resistance zone is key for further upward breakthroughs.
Conclusion
Overall, the SWK stock is exhibiting an upward trend, although the presence of support and resistance zones indicate potential price barriers. Investors should watch for movement beyond the resistance level to affirm continued upward momentum. Conversely, if the stock falls below the support zones, it may indicate a reversal or a more significant corrective phase. The current positioning provides an opportunity for investment with a consideration for potential corrections.
Smart Data Insight
Master the Perfect Entry & Exit for this Stock
Don't leave your profits to chance. Historically, this stock follows specific seasonal patterns that institutional traders use to maximize returns.
- ✅ Identify the "Golden Buying Window"
- ✅ Avoid high-risk correction cycles
- ✅ Backtested data from the last 20+ years