
July 15, 2026 a 07:31 am


📊 SWK: Dividend Analysis - Stanley Black & Decker, Inc.
Stanley Black & Decker, Inc. showcases a strong and consistent dividend profile with over four decades of uninterrupted dividend history. Its current dividend yield stands at an appealing 4.23%, attracting income-focused investors. However, its high EPS payout ratio may raise sustainability concerns amidst fluctuating earnings performance.
🗣️ Overview
Stanley Black & Decker, Inc. operates within the industrial sector and is known for its robust dividend history. With a dividend yield of 4.23%, supported by a current dividend per share of $3.31, the company stands out in the market. It has a remarkable 42 years of dividend history, demonstrating its commitment to returning value to shareholders. Notably, there has been no recent dividend cut or suspension.
| Key Metric | Value |
|---|---|
| Sector | Industrial |
| Dividend Yield | 4.23% |
| Current Dividend Per Share | $3.31 |
| Dividend History | 42 years |
| Last Cut or Suspension | None |
📉 Dividend History
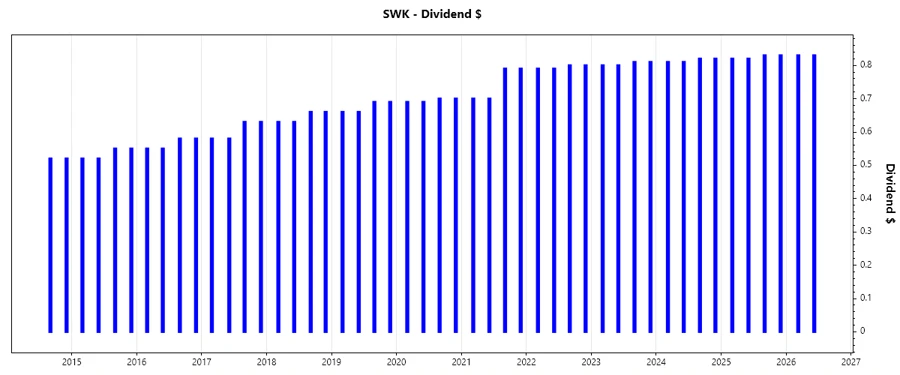
The consistency in Stanley Black & Decker's dividend payments over the years highlights its financial discipline and commitment to returning capital to shareholders. Historical payments reflect the company's earnings stability and strategic planning, essential metrics for assessing investment viability.
| Year | Dividend Per Share (USD) |
|---|---|
| 2026 | 1.66 |
| 2025 | 3.30 |
| 2024 | 3.26 |
| 2023 | 3.22 |
| 2022 | 3.18 |
📈 Dividend Growth
Stanley Black & Decker's recent dividend growth trends offer insights into its future dividend potential. Over the past five years, the annual dividend growth has been approximately 3.49%, which, while modest, indicates a stable increase in shareholder returns. Long-term growth prospects remain integral for assessing ongoing investment potential.
| Time | Growth |
|---|---|
| 3 years | 1.24% |
| 5 years | 3.49% |
The average dividend growth is 3.49% over 5 years. This shows moderate but steady dividend growth.
✅ Payout Ratio
The payout ratios provide crucial insights into the sustainability of dividends. With an EPS-based payout ratio of 135.18% and an FCF-based ratio of 70.82%, there is a notable disparity indicating a reliance on cash flow over net income to support payouts. This may suggest longer-term challenges in maintaining current dividend levels without earnings growth.
| Key Figure | Ratio |
|---|---|
| EPS-based | 135.18% |
| Free Cash Flow-based | 70.82% |
The EPS payout ratio is notably high at 135.18%, signifying potential dividend sustainability issues if earnings do not improve, while FCF coverage appears healthier at 70.82%.
💵 Cashflow & Capital Efficiency
Examining cash flow metrics highlights the company's operational efficiency and capital allocation strategies. Stanley Black & Decker's cash flow yield and capital expenditure ratios reflect its capacity to fund dividends and growth initiatives internally, a critical factor for sustainability.
| Metric | 2025 | 2024 | 2023 |
|---|---|---|---|
| Free Cash Flow Yield | 5.94% | 6.21% | 5.80% |
| Earnings Yield | 3.47% | 2.36% | -1.92% |
| CAPEX to Operating Cash Flow | 29.17% | 31.97% | 28.43% |
| Stock-based Compensation to Revenue | 0.55% | 0.69% | 0.53% |
| Free Cash Flow/Operating Cash Flow Ratio | 70.83% | 68.03% | 71.57% |
| Return on Invested Capital | 6.41% | 7.69% | 3.59% |
Stanley Black & Decker demonstrates efficient capital utilization and cash flow generation, favorably supporting dividends and reinvestment in business operations.
💼 Balance Sheet & Leverage Analysis
A thorough examination of balance sheet metrics offers insights into financial stability and debt levels. Current debt-to-equity and asset ratios indicate a moderate leverage position, which, while manageable, requires consistent monitoring to avoid liquidity pressures.
| Metric | 2025 | 2024 | 2023 |
|---|---|---|---|
| Debt-to-Equity | 66.23% | 75.63% | 80.66% |
| Debt-to-Assets | 28.23% | 30.18% | 30.87% |
| Debt-to-Capital | 39.84% | 43.06% | 44.65% |
| Net Debt to EBITDA | 4.50 | 4.76 | 8.54 |
| Current Ratio | 1.14 | 0.00 | 0.00 |
| Quick Ratio | 0.35 | 0.37 | 0.39 |
| Financial Leverage | 2.35 | 2.51 | 2.61 |
The balance sheet suggests a leveraged financial strategy with certain risks, yet with measures in place to manage current operational liabilities effectively.
📉 Fundamental Strength & Profitability
Evaluating core financial metrics such as return on equity and asset margins provide a comprehensive understanding of performance efficiency and profitability. Despite recent pressure on profit margins, Stanley Black & Decker exhibits fundamental resilience.
| Metric | 2025 | 2024 | 2023 |
|---|---|---|---|
| Return on Equity | 4.44% | 3.28% | -3.11% |
| Return on Assets | 1.89% | 1.31% | -1.19% |
| Margins: Net | 2.66% | 1.86% | -1.79% |
| EBIT | 5.83% | 4.77% | 1.13% |
| EBITDA | 8.40% | 8.61% | 5.09% |
| Gross | 29.86% | 29.94% | 25.98% |
| Research & Development to Revenue | 0.00% | 2.14% | 2.29% |
While profitability has experienced recent volatility, core metrics reflect potential for recovery and long-term share value enhancement.
📈 Price Development
🏆 Dividend Scoring System
| Criteria | Score | Score Bar |
|---|---|---|
| Dividend Yield | 4 | |
| Dividend Stability | 5 | |
| Dividend Growth | 3 | |
| Payout Ratio | 2 | |
| Financial Stability | 3 | |
| Dividend Continuity | 5 | |
| Cashflow Coverage | 4 | |
| Balance Sheet Quality | 3 |
Total Score: 29/40
🗳️ Rating
Stanley Black & Decker, Inc. maintains a commendable position as a dividend stock, with a robust history of payouts and moderate yield. The recent volatility in fundamentals necessitates caution, but the strong legacy and steady cash flow coverage underpin a hold rating for dividend-seeking investors.
Smart Data Insight
Master the Perfect Entry & Exit for this Stock
Don't leave your profits to chance. Historically, this stock follows specific seasonal patterns that institutional traders use to maximize returns.
- ✅ Identify the "Golden Buying Window"
- ✅ Avoid high-risk correction cycles
- ✅ Backtested data from the last 20+ years