June 15, 2026 a 03:31 pm


SWK: Dividend Analysis - Stanley Black & Decker, Inc.
Stanley Black & Decker, Inc. has been a staple in the dividend community, with over four decades of dividend history. Despite recent challenges reflected in its payout ratios, the company's long-standing commitment to its dividend is evident. With a current yield of 4.23%, the stock might appeal to income-focused investors, though caution is suggested given the high payout ratio relative to earnings.
Overview 📊
Stanley Black & Decker operates within the industrial goods sector, and its dividend yield currently stands at an appealing 4.23%. The company has maintained a dividend payout for an impressive 42 years, with steady payments even during financial downturns. Its last dividend cut is recorded as non-existent, demonstrating a strong historical commitment to returning capital to shareholders.
| Sector | Dividend Yield | Current Dividend per Share | Dividend History Years | Last Cut or Suspension |
|---|---|---|---|---|
| Industrial Goods | 4.23% | 3.31 USD | 42 years | None |
Dividend History 🗣️
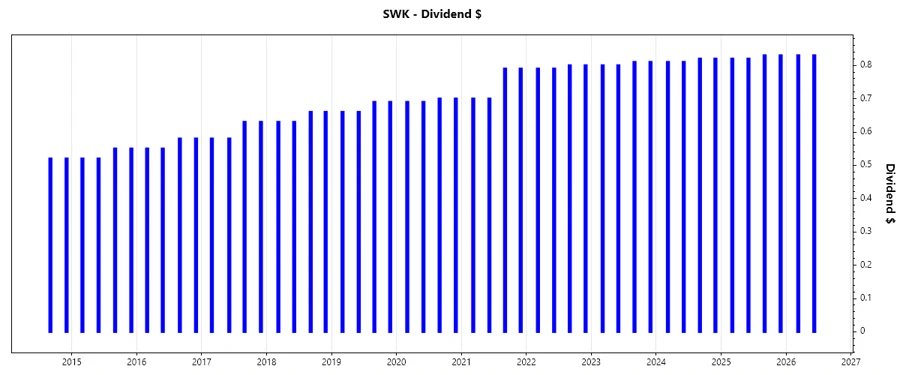
The ability to sustain dividend payments is crucial for long-term investors. Stanley Black & Decker's dividend history showcases a consistent uptrend, reflecting its management's commitment to rewarding shareholders. This history is essential for gauging reliability and historical growth trends, which aid in assessing future income potential.
| Year | Dividend per Share |
|---|---|
| 2026 | 1.66 |
| 2025 | 3.30 |
| 2024 | 3.26 |
| 2023 | 3.22 |
| 2022 | 3.18 |
Dividend Growth 📈
Analyzing dividend growth over time provides insight into a company's earnings growth and cash flow stability. Here, Stanley Black & Decker exhibits moderate dividend growth over the last five years, which may appeal to conservative income investors seeking stability with their returns.
| Time | Growth |
|---|---|
| 3 years | 1.24% |
| 5 years | 3.49% |
The average dividend growth is 3.49% over 5 years. This shows moderate but steady dividend growth.
Payout Ratio 📉
A high payout ratio, like the 135.18% (EPS) reported, implies the company is distributing more than its earnings in dividends, which might be unsustainable in the long run. Similarly, a 70.82% (FCF) payout is substantial, suggesting limited room for future dividend increases unless earnings or free cash flow growth accelerates.
| Key Figure | Ratio |
|---|---|
| EPS-based | 135.18% |
| Free cash flow-based | 70.82% |
Cashflow & Capital Efficiency ✅
Evaluating cash flows and capital efficiency allows investors to understand how effectively a company is converting its profits into cash, critical for funding dividends.
| Year | 2023 | 2024 | 2025 |
|---|---|---|---|
| Free Cash Flow Yield | 5.80% | 6.21% | 5.94% |
| Earnings Yield | -1.92% | 2.36% | 3.47% |
| CAPEX/Operating Cash Flow | 28.43% | 31.97% | 29.17% |
| Stock-based Compensation/Revenue | 0.53% | 0.69% | 0.55% |
| Free Cash Flow/Operating Cash Flow Ratio | 71.57% | 68.03% | 70.83% |
The company's capital efficiency is moderate, with its free cash flow yield suggesting potential for financial resilience if managed prudently.
Balance Sheet & Leverage Analysis ⚠️
A strong balance sheet is vital for a company's dividend sustainability. Evaluating leverage ratios helps to assess the company's financial stability and its capability to handle its obligations during economic fluctuations.
| Year | 2023 | 2024 | 2025 |
|---|---|---|---|
| Debt-to-Equity | 80.66% | 75.63% | 66.23% |
| Debt-to-Assets | 30.87% | 30.18% | 28.23% |
| Debt-to-Capital | 44.65% | 43.06% | 39.84% |
| Net Debt to EBITDA | 8.54 | 4.76 | 4.50 |
| Current Ratio | 1.19 | 1.30 | 1.14 |
| Quick Ratio | 0.39 | 0.37 | 0.35 |
| Financial Leverage | 2.61 | 2.51 | 2.35 |
The balance sheet reflects moderate leverage, which, if not managed with a focus on operational efficiency, might limit strategic flexibility.
Fundamental Strength & Profitability 🗝️
These metrics are essential to gauge overall business health and future growth potential. Focusing on profitability and return on investment helps investors understand the efficiency of a company in generating profits.
| Year | 2023 | 2024 | 2025 |
|---|---|---|---|
| Return on Equity | -3.11% | 3.28% | 4.44% |
| Return on Assets | -1.19% | 1.31% | 1.89% |
| Net Margin | -1.79% | 1.86% | 2.66% |
| EBIT Margin | 1.13% | 4.77% | 5.83% |
| EBITDA Margin | 5.09% | 8.61% | 8.40% |
| Gross Margin | 25.98% | 29.94% | 29.86% |
| R&D to Revenue | 2.29% | 2.14% | 0% |
Profitability metrics are showing improvement year over year, though return on equity is still low. There might be scope for improvement in asset and capital efficiencies.
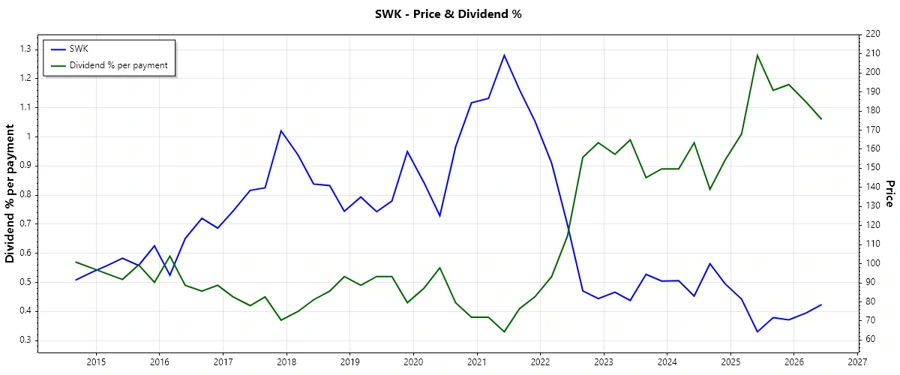
Price Development 📉
Dividend Scoring System 🎯
| Category | Description | Score |
|---|---|---|
| Dividend Yield | Indicator of relative return | |
| Dividend Stability | Consistency of payments | |
| Dividend Growth | Historical increase | |
| Payout Ratio | Sustainability of distribution | |
| Financial Stability | Debt and liquidity | |
| Dividend Continuity | Record of uninterrupted payment | |
| Cashflow Coverage | Ability to support payouts | |
| Balance Sheet Quality | Asset and liability assessment |
Total Score: 27/40
Rating 🌟
Stanley Black & Decker, Inc. offers an attractive dividend yield supported by a long history of payments. While current payout ratios raise concerns about sustainability, the firm remains a viable option for dividend-focused investors, potentially providing moderate income with stability for risk-tolerant investors.
Smart Data Insight
Master the Perfect Entry & Exit for this Stock
Don't leave your profits to chance. Historically, this stock follows specific seasonal patterns that institutional traders use to maximize returns.
- ✅ Identify the "Golden Buying Window"
- ✅ Avoid high-risk correction cycles
- ✅ Backtested data from the last 20+ years