
May 25, 2026 a 11:31 am

SWK: Dividend Analysis - Stanley Black & Decker, Inc.
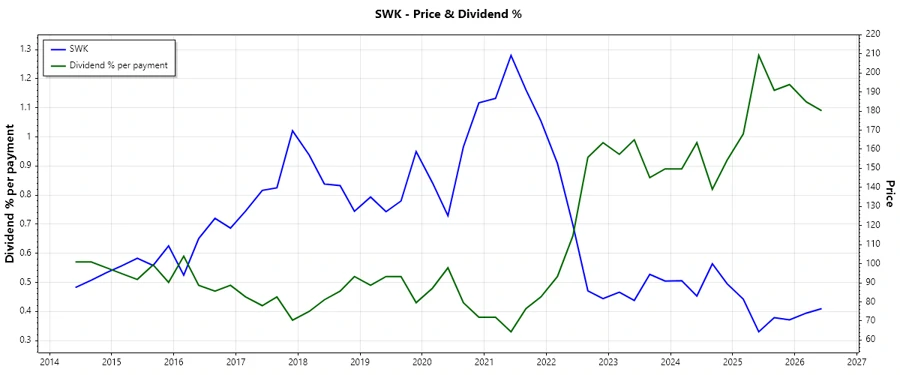
Stanley Black & Decker, Inc. continues to show a resilient dividend history, marked by over four decades of consistent dividend payments. Despite the elevated payout ratio, the company's strong position within its sector offers encouragement to yield-seeking investors. However, the high EPS payout ratio suggests that the company might face challenges in maintaining this streak without sufficient earnings growth. Overall, the company's dividend profile provides promise but invites caution regarding sustainability.
📊 Overview
| Details | Values |
|---|---|
| Sector | Industrial Goods |
| Dividend yield | 4.34 % |
| Current dividend per share | 3.31 USD |
| Dividend history | 42 years |
| Last cut or suspension | None |
📈 Dividend History
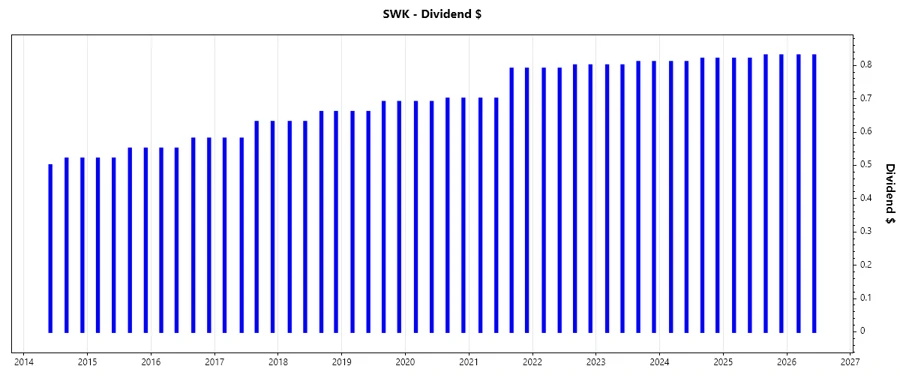
Stanley Black & Decker's unbroken dividend history of 42 years is noteworthy, reflecting a robust commitment to returning capital to shareholders. This persistence not only benefits current investors but also attracts future investments as it indicates the company's reliability in paying dividends even during economic downturns. The consistency is critical for conservative investors who depend on dividend stability.
| Year | Dividend per Share (USD) |
|---|---|
| 2026 | 1.66 |
| 2025 | 3.30 |
| 2024 | 3.26 |
| 2023 | 3.22 |
| 2022 | 3.18 |
📈 Dividend Growth
The company's rate of dividend growth over 3 and 5 years is crucial as it showcases the potential future income stream. A sustainable and accelerating dividend growth rate often serves as a fundamental measure of a firm's ability to grow earnings and cash flow.
| Time | Growth |
|---|---|
| 3 years | 1.24 % |
| 5 years | 3.49 % |
The average dividend growth is 3.49 % over 5 years. This shows moderate but steady dividend growth. Investors should ensure that the company's cash generation can sustain this growth without jeopardizing financial stability.
📉 Payout Ratio
Analyzing the payout ratio helps evaluate if the earnings support the dividend or if there's a risk of reduction. A payout ratio that exceeds 100% suggests the dividends are not fully covered by earnings, raising sustainability concerns.
| Key figure ratio | Value |
|---|---|
| EPS-based | 135.18 % |
| Free cash flow-based | 70.82 % |
With a substantial EPS payout ratio of 135.18 %, Stanley Black & Decker is overextending its earnings for dividend coverage, which could pose a threat should earnings fail to recover. However, the FCF payout ratio of 70.82 % is more manageable, suggesting that operational cash flow currently supports the dividend distribution.
🗣️ Cashflow & Capital Efficiency
Understanding cash flow dynamics and capital efficiency is pivotal, as they indicate how efficiently a company converts investments into revenue and cash.
| Year | 2023 | 2024 | 2025 |
|---|---|---|---|
| Free Cash Flow Yield | 5.80 % | 6.21 % | 5.94 % |
| Earnings Yield | -1.92 % | 2.36 % | 3.47 % |
| CAPEX to Operating Cash Flow | 28.43 % | 31.97 % | 29.17 % |
| Stock-based Compensation to Revenue | 0.53 % | 0.69 % | 0.55 % |
| Free Cash Flow / Operating Cash Flow Ratio | 71.57 % | 68.03 % | 70.83 % |
| Return on Invested Capital | 3.59 % | 7.69 % | 7.21 % |
The company's cash flow metrics imply solid capital efficiency, yet maintaining positive free cash flow conditions is vital especially considering the variable return on invested capital which reflects the efficiency of generating revenue from its capital.
🗣️ Balance Sheet & Leverage Analysis
The balance sheet analysis offers insights into leverage and long-term financial stability. Key ratios such as debt-to-equity and current ratio provide a glimpse into the company’s ability to honor its liabilities.
| Year | 2023 | 2024 | 2025 |
|---|---|---|---|
| Debt-to-Equity | 81 % | 76 % | 65 % |
| Debt-to-Assets | 31 % | 30 % | 28 % |
| Debt-to-Capital | 45 % | 43 % | 39 % |
| Net Debt to EBITDA | 8.54 | 4.76 | 4.39 |
| Current Ratio | 1.19 | 1.30 | 1.14 |
| Quick Ratio | 0.39 | 0.37 | 0.35 |
| Financial Leverage | 2.61 | 2.51 | 2.35 |
While leverage ratios indicate a notable amount of debt, the current and quick ratio signify sufficient short-term liquidity. Maintaining solvency through debt management remains crucial for the firm's financial health.
🗣️ Fundamental Strength & Profitability
Examining profitability metrics like return on equity, return on assets, and margin trends helps assess operational efficiency and effectiveness.
| Year | 2023 | 2024 | 2025 |
|---|---|---|---|
| Return on Equity | -3.11 % | 3.28 % | 4.44 % |
| Return on Assets | -1.19 % | 1.31 % | 1.89 % |
| Margins: Net | -1.79 % | 1.86 % | 2.66 % |
| Margins: EBIT | 1.13 % | 4.77 % | 5.83 % |
| Margins: EBITDA | 5.09 % | 8.61 % | 8.40 % |
| Margins: Gross | 25.98 % | 29.94 % | 29.86 % |
| Research & Development to Revenue | 2.29 % | 0 % | 0 % |
The profitability metrics show improvement post-2023, although initial negative figures raise caution. It’s crucial to have sustained profitability levels to boost investor confidence and ensure adequate returns.
📉 Price Development
✅ Dividend Scoring System
| Category | Score | Indicator |
|---|---|---|
| Dividend Yield | 4 | |
| Dividend Stability | 5 | |
| Dividend Growth | 3 | |
| Payout Ratio | 2 | |
| Financial Stability | 3 | |
| Dividend Continuity | 4 | |
| Cashflow Coverage | 3 | |
| Balance Sheet Quality | 3 |
Total Score: 27/40
✅ Rating
Stanley Black & Decker, Inc. holds a firm position as a reliable dividend payer due to its impressive continuity and yield; however, cautious optimism is advised given its high payout ratio relative to earnings. For yield-focused investors, the firm offers attraction, though diversifying across more financially stable companies might offset associated risks.
Smart Data Insight
Master the Perfect Entry & Exit for this Stock
Don't leave your profits to chance. Historically, this stock follows specific seasonal patterns that institutional traders use to maximize returns.
- ✅ Identify the "Golden Buying Window"
- ✅ Avoid high-risk correction cycles
- ✅ Backtested data from the last 20+ years