
May 05, 2026 a 02:46 am

SWK: Dividend Analysis - Stanley Black & Decker, Inc.
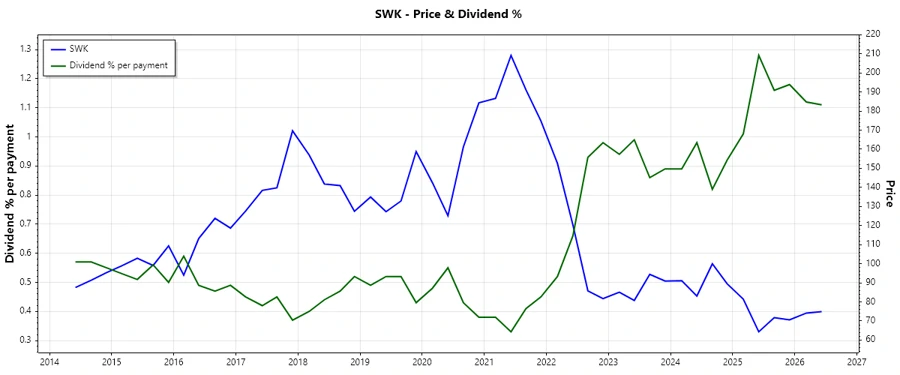
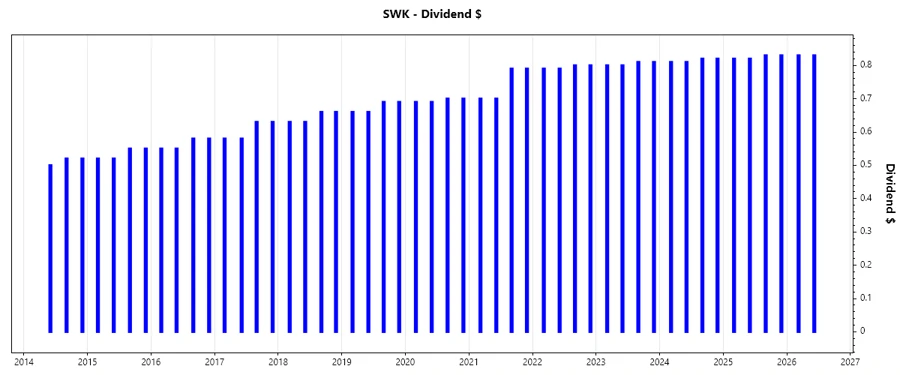
Stanley Black & Decker presents a robust dividend history, illustrating resilience with 42 consecutive years of dividends and no cuts despite challenging market conditions. The current dividend yield provides an appealing income for investors, although payout ratios indicate some caution on sustainability under current earnings pressure. Strategic operational enhancements may be pivotal to sustain dividend growth.
📊 Overview
| Attribute | Details |
|---|---|
| Sector | Manufacturing |
| Dividend yield | 4.43% |
| Current dividend per share | 3.31 USD |
| Dividend history | 42 years |
| Last cut or suspension | None |
⏳ Dividend History
The long history of dividends showcases Stanley Black & Decker's commitment to returning value to shareholders, instilling investor confidence. Long-term consistency also reflects its potential stability in cyclical downturns.
| Year | Dividend Per Share (USD) |
|---|---|
| 2026 | 1.66 |
| 2025 | 3.30 |
| 2024 | 3.26 |
| 2023 | 3.22 |
| 2022 | 3.18 |
📈 Dividend Growth
Analyzing dividend growth over time can indicate the company's capability to enhance shareholder returns, suggesting improved profitability and cash flow generation.
| Time | Growth |
|---|---|
| 3 years | 1.24% |
| 5 years | 3.49% |
The average dividend growth is 3.49% over 5 years. This shows moderate but steady dividend growth.
🧮 Payout Ratio
The payout ratio measures the sustainability of dividends given current earnings and cash flow characteristics. A high payout ratio may stress future dividends if not supported by significant income growth.
| Key Figure | Ratio |
|---|---|
| EPS-based | 135.18% |
| Free cash flow-based | 70.82% |
The EPS-based ratio of 135.18% indicates dividends are outstripping earnings, potentially unsustainable without earning improvement. FCF-based at 70.82% suggests better but cautious comfort.
💵 Cashflow & Capital Efficiency
Efficient cash flow management and capital allocation facilitate company growth and shareholder returns, crucial for maintaining dividend payouts.
| Year | 2023 | 2024 | 2025 |
|---|---|---|---|
| Free Cash Flow Yield | 5.80% | 6.21% | 5.94% |
| Earnings Yield | -1.92% | 2.36% | 3.47% |
| CAPEX to Operating Cash Flow | 28.43% | 31.97% | 29.17% |
| Stock-based Compensation to Revenue | 0.53% | 0.69% | 0.55% |
| Free Cash Flow / Operating Cash Flow Ratio | 71.57% | 68.03% | 70.83% |
The stability of cash flows indicates reliable capital management, though earnings volatility could present future challenges for steady cash flow growth.
📝 Balance Sheet & Leverage Analysis
A healthy balance sheet with optimal leverage ensures financial stability, necessary for sustaining dividend payments and potential growth investments.
| Year | 2023 | 2024 | 2025 |
|---|---|---|---|
| Debt-to-Equity | 0.81 | 0.76 | 0.65 |
| Debt-to-Assets | 30.87% | 30.18% | 27.60% |
| Debt-to-Capital | 44.65% | 43.06% | 39.31% |
| Net Debt to EBITDA | 8.54 | 4.76 | 4.39 |
| Current Ratio | 1.19 | 1.30 | 1.14 |
| Quick Ratio | 0.39 | 0.37 | 0.35 |
| Financial Leverage | 2.61 | 2.51 | 2.35 |
The company demonstrates some over-leverage concerns, reflected in its high net debt to EBITDA, yet shows declining trends, suggesting gradual balance sheet improvements.
📊 Fundamental Strength & Profitability
Return metrics and profit margins serve as indicators of operational efficiency and overall profitability, crucial for sustaining long-term dividend payments.
| Year | 2023 | 2024 | 2025 |
|---|---|---|---|
| Return on Equity | -3.11% | 3.28% | 4.44% |
| Return on Assets | -1.19% | 1.31% | 1.89% |
| Margins: Net | -1.79% | 1.86% | 2.66% |
| Margins: EBIT | 1.13% | 4.77% | 5.83% |
| Margins: EBITDA | 5.09% | 8.61% | 8.40% |
| Margins: Gross | 25.98% | 29.94% | 29.86% |
| Research & Development to Revenue | 2.29% | 2.14% | 0.00% |
Strong marginal recoveries and returns on investment point to operational enhancements, propelling profitability forward, despite recent financial instability.
📈 Price Development
🗣️ Dividend Scoring System
| Category | Score | Score Bar |
|---|---|---|
| Dividend yield | 4 | |
| Dividend Stability | 5 | |
| Dividend growth | 3 | |
| Payout ratio | 2 | |
| Financial stability | 3 | |
| Dividend continuity | 5 | |
| Cashflow Coverage | 4 | |
| Balance Sheet Quality | 3 |
Total Score: 29/40
✅ Rating
The overall assessment suggests Stanley Black & Decker's dividend remains an appealing income investment, with commendable historical reliability. However, sustainability may face pressure if earnings growth stagnates. Investors should monitor fiscal strategies aimed at reducing leverage and enhancing free cash flow, which are crucial to securing dividend progression.
Smart Data Insight
Master the Perfect Entry & Exit for this Stock
Don't leave your profits to chance. Historically, this stock follows specific seasonal patterns that institutional traders use to maximize returns.
- ✅ Identify the "Golden Buying Window"
- ✅ Avoid high-risk correction cycles
- ✅ Backtested data from the last 20+ years