March 22, 2026 a 07:31 am

SWK: Dividend Analysis - Stanley Black & Decker, Inc.
Stanley Black & Decker, Inc. represents a significant player in its sector, showcasing a robust dividend history. Despite a current high payout ratio, the company's long-standing dividend payments highlight its commitment to returning value to shareholders. Investors should consider both the consistent dividends and the underlying financial strengths and weaknesses for a comprehensive investment perspective.
📊 Overview
Stanley Black & Decker operates in the industrial sector, boasting a dividend yield of 4.47%, with a current dividend of 3.31 USD per share. It has a commendable dividend history of 42 years without recent cuts, underscoring a strong continuity in shareholder returns.
| Detail | Value |
|---|---|
| Sector | Industrial |
| Dividend Yield | 4.47% |
| Current Dividend per Share | 3.31 USD |
| Dividend History | 42 years |
| Last Cut or Suspension | None |
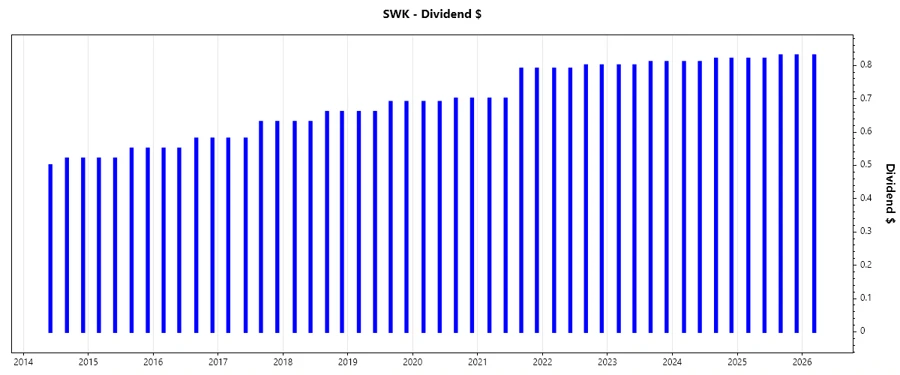
📜 Dividend History
The dividend history of Stanley Black & Decker is notable, as it depicts a reliable and growing cash return to shareholders over decades. This historic consistency can indicate financial health and management's stable cash flow practices.
| Year | Dividend per Share (USD) |
|---|---|
| 2026 | 0.83 |
| 2025 | 3.30 |
| 2024 | 3.26 |
| 2023 | 3.22 |
| 2022 | 3.18 |
📈 Dividend Growth
The dividend growth trend is a crucial indicator of the company's earnings power and its willingness to distribute profits back to shareholders. A sustainable growth rate reflects positively on the company’s long-term prospects and profitability.
| Time | Growth |
|---|---|
| 3 years | 1.24% |
| 5 years | 3.49% |
The average dividend growth is 3.49% over 5 years. This shows moderate but steady dividend growth.
✅ Payout Ratio
Payout ratios are critical in assessing a company's ability to sustain its dividend payments. A high payout ratio can indicate financial stress or reduced flexibility in capital allocation.
| Payout Ratio Type | Percentage |
|---|---|
| EPS-based | 124.56% |
| Free Cash Flow-based | 74.52% |
The EPS-based payout ratio of 124.56% suggests that the dividends exceed the net earnings, indicating potential sustainability concerns. Conversely, the FCF-based payout ratio of 74.52% is more sustainable, suggesting the dividends are covered by cash flow operations.
💰 Cashflow & Capital Efficiency
Analyzing cash flow metrics and capital efficiency provides insights into the company's ability to generate sustainable cash flow and use its assets efficiently for generating returns.
| Metric | 2025 | 2024 | 2023 |
|---|---|---|---|
| Free Cash Flow Yield | 5.94% | 6.21% | 5.80% |
| Earnings Yield | 3.47% | 2.36% | -1.92% |
| CAPEX to Operating Cash Flow | 29.17% | 31.97% | 28.43% |
| Stock-based Compensation to Revenue | 0.55% | 0.69% | 0.53% |
| Free Cash Flow / Operating Cash Flow Ratio | 70.83% | 68.03% | 71.57% |
The cash flow metrics suggest stability in generating operational cash flow. Capital efficiency indicators like earnings yield and CAPEX compared to cash flow reinforce the company's efforts in maintaining financial health despite challenges.
⚠️ Balance Sheet & Leverage Analysis
Balance sheet and leverage ratios are essential for understanding financial stability and debt management, guiding assessments on liquidity and financial structure benefits or risks.
| Metric | 2025 | 2024 | 2023 |
|---|---|---|---|
| Debt-to-Equity | 0.648 | 0.756 | 0.807 |
| Debt-to-Assets | 0.276 | 0.302 | 0.309 |
| Debt-to-Capital | 0.393 | 0.431 | 0.446 |
| Net Debt to EBITDA | 4.009 | 4.765 | 8.540 |
| Current Ratio | 1.14 | 1.30 | 1.19 |
| Quick Ratio | 0.347 | 0.374 | 0.387 |
| Financial Leverage | 2.35 | 2.51 | 2.61 |
The high leverage and moderate liquidity ratios suggest careful management of the balance sheet is necessary to mitigate potential financial constraints or vulnerabilities.
🏢 Fundamental Strength & Profitability
Profitability and fundamental strengths reflect the company's ability to achieve financial growth and sustain operations effectively, indicating broader strategic success.
| Metric | 2025 | 2024 | 2023 |
|---|---|---|---|
| Return on Equity | 4.44% | 3.28% | -3.11% |
| Return on Assets | 1.89% | 1.31% | -1.19% |
| Margins: Net | 2.66% | 1.86% | -1.78% |
| Margins: EBIT | 5.83% | 4.77% | 1.13% |
| Margins: EBITDA | 8.40% | 8.61% | 5.09% |
| Margins: Gross | 29.86% | 29.94% | 25.98% |
| Research & Development to Revenue | 0% | 2.14% | 2.29% |
Although financial returns illustrate fluctuating profitability, strategic cost allocations in R&D and operational efficiencies present potential for improvement and innovation.
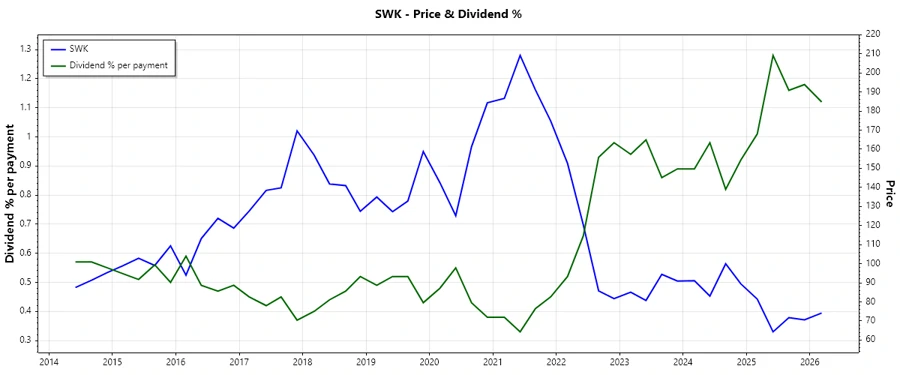
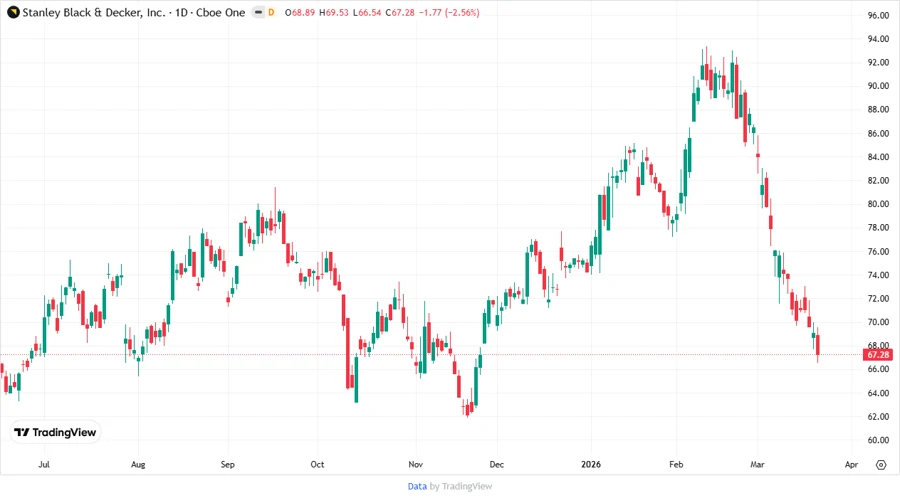
📉 Price Development
🔑 Dividend Scoring System
| Criteria | Score | |
|---|---|---|
| Dividend yield | 4 | |
| Dividend Stability | 5 | |
| Dividend growth | 3 | |
| Payout ratio | 2 | |
| Financial stability | 3 | |
| Dividend continuity | 5 | |
| Cashflow Coverage | 3 | |
| Balance Sheet Quality | 3 |
Overall Score: 28/40
🗣️ Rating
Stanley Black & Decker, Inc. continues to maintain a strong dividend profile despite challenges in payout ratios. The company's commendable history of dividend continuity and yield makes it an attractive investment for income-focused investors, provided they remain cautious about the high payout levels and leverage metrics.
Smart Data Insight
Master the Perfect Entry & Exit for this Stock
Don't leave your profits to chance. Historically, this stock follows specific seasonal patterns that institutional traders use to maximize returns.
- ✅ Identify the "Golden Buying Window"
- ✅ Avoid high-risk correction cycles
- ✅ Backtested data from the last 20+ years