October 16, 2025 a 02:47 am


SWK: Dividend Analysis - Stanley Black & Decker, Inc.
Stanley Black & Decker, Inc. (SWK) stands as a significant player in the tools and hardware sector, showcasing a robust dividend history with consistent payments for 41 years. While its current dividend yield of 4.59% appeals to income investors, recent payout ratios exceeding earnings raise caution. Nonetheless, its long-standing reputation and moderate growth make it a key consideration, provided financial sustainability checks out.
📊 Overview
| Attribute | Value |
|---|---|
| Sector | Tools & Hardware |
| Dividend yield | 4.59% |
| Current dividend per share | 3.26 USD |
| Dividend history | 41 years |
| Last cut or suspension | None |
SWK's dividend yield is competitive within its sector, supported by an impressively stable 41-year history. Despite the satisfactory yield, the financial constraints reflected in a high payout ratio necessitate prudence.
🗣️ Dividend History
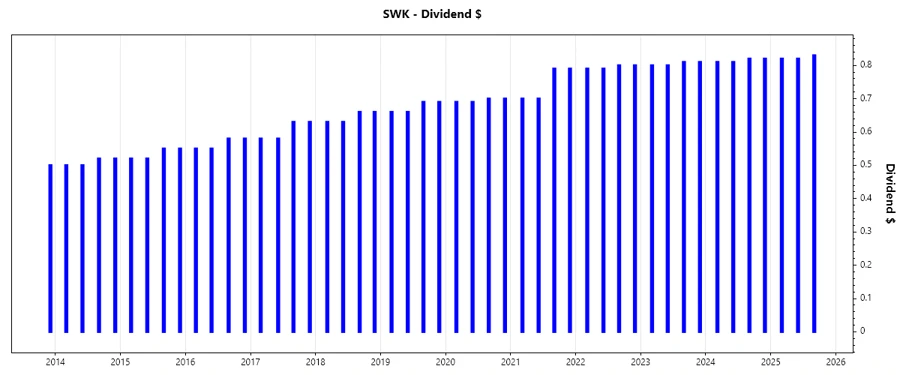
The historical consistency in dividends truly cements SWK's position as a reliable income source. Its continuous 41-year track record is a testament to disciplined financial management and commitment to shareholders.
| Year | Dividend Per Share (USD) |
|---|---|
| 2025 | 2.47 |
| 2024 | 3.26 |
| 2023 | 3.22 |
| 2022 | 3.18 |
| 2021 | 2.98 |
This chart provides a vivid illustration of SWK's consistent dividend payments, reflecting its resilience even amidst fluctuating economic conditions.
📈 Dividend Growth
The analysis of dividend growth over multiple periods unveils SWK's approach to enhancing shareholder value. With a modest growth rate, it's clear SWK sets attainable yet steady financial objectives for dividend expansion.
| Time | Growth |
|---|---|
| 3 years | 3.04% |
| 5 years | 3.84% |
The average dividend growth is 3.84% over 5 years. This shows moderate but steady dividend growth. While not aggressive, it aligns well with long-term financial stability priorities.
📉 Payout Ratio
SWK's payout ratios highlight a critical dimension of its dividend sustainability. High payout relative to earnings and cash flow denotes potential overextension, warranting vigilant monitoring.
| Key figure | Ratio (%) |
|---|---|
| EPS-based | 122.38% |
| Free cash flow-based | 102.38% |
With an EPS payout ratio of 122.38% and a free cash flow payout ratio of 102.38%, SWK's dividend policy seems overly ambitious. Such figures suggest the dividends may not be sustainable without an improvement in earnings or cash flows.
✅ Cashflow & Capital Efficiency
Understanding cash flow and capital use metrics offers insights into SWK's operational effectiveness and shareholder returns, crucial for long-term success in any dividend strategy.
| Metric | 2024 | 2023 | 2022 |
|---|---|---|---|
| Free Cash Flow Yield | 6.21% | 5.80% | -17.88% |
| Earnings Yield | 2.43% | -2.11% | 1.53% |
| CAPEX/Operating Cash Flow | 31.97% | 28.43% | -36.34% |
| Stock Compensation/Revenue | 0.69% | 0.53% | 0.54% |
| Free Cash Flow/Operating Cash Flow | 68.03% | 71.57% | 136.34% |
SWK's cash flow metrics reflect periods of volatility, particularly in 2022. The elevated CAPEX spending raises questions of future cash flow adequacy but could indicate strategic investments.
⚠️ Balance Sheet & Leverage Analysis
Analyzing the balance sheet ratios provides a picture of SWK's debt management, liquidity, and overall financial solidity, key components for sustained dividend distribution.
| Metric | 2024 | 2023 | 2022 |
|---|---|---|---|
| Debt-to-Equity | 71.44% | 80.66% | 76.78% |
| Debt-to-Assets | 28.51% | 30.87% | 29.87% |
| Debt-to-Capital | 41.67% | 44.65% | 43.43% |
| Net Debt to EBITDA | 4.46 | 8.54 | 7.49 |
| Current Ratio | 1.30 | 1.19 | 1.22 |
| Quick Ratio | 0.37 | 0.39 | 0.32 |
| Financial Leverage | 2.51 | 2.61 | 2.57 |
SWK appears to have a balanced approach to leverage, maintaining a steady current ratio. However, high net debt relative to EBITDA in recent years suggests caution in risk mitigation strategies.
📊 Fundamental Strength & Profitability
Fundamentals of profitability and sound financial practices indicate SWK's capacity to generate returns, vital for sustaining dividend payouts.
| Metric | 2024 | 2023 | 2022 |
|---|---|---|---|
| Return on Equity | 3.38% | -3.43% | 1.75% |
| Return on Assets | 1.35% | -1.31% | 0.68% |
| Net Margin | 1.92% | -1.97% | 1.00% |
| EBIT Margin | 4.81% | 1.16% | 2.22% |
| EBITDA Margin | 8.61% | 5.09% | 5.56% |
| Gross Margin | 29.38% | 25.97% | 25.28% |
| R&D to Revenue | 2.14% | 2.29% | 2.11% |
SWK's fundamentals reveal cyclic ROE figures, which could affect future dividend payments. The modest R&D investment suggests a focus more on core operational efficiencies rather than innovation.
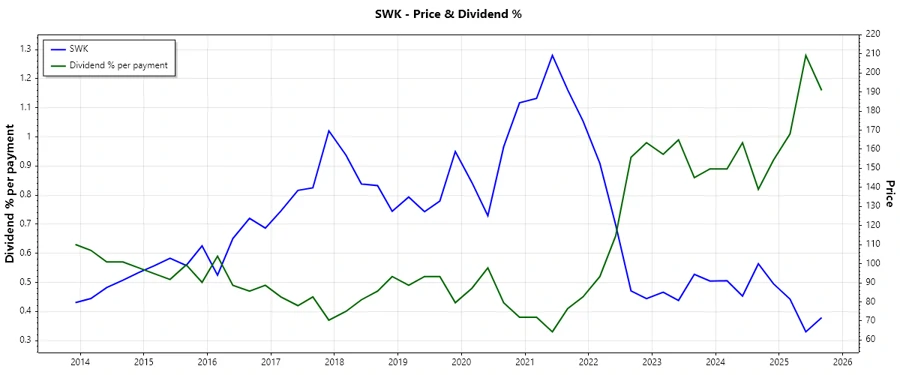
📉 Price Development
The stock price development over recent years yields insights into market perception, often correlating with dividend and earning trends.
✅ Dividend Scoring System
| Category | Score | Indicator |
|---|---|---|
| Dividend yield | 4 | |
| Dividend Stability | 5 | |
| Dividend growth | 3 | |
| Payout ratio | 2 | |
| Financial stability | 3 | |
| Dividend continuity | 5 | |
| Cashflow Coverage | 3 | |
| Balance Sheet Quality | 3 |
Total Score: 28/40
SWK exhibits a high degree of dividend stability and continuity, but its financial and payout ratios highlight areas of potential concern. Overall, a strong contender with some financial risks to consider.
🗣️ Rating
SWK holds a commendable position for dividend investors with its enduring history and decent yield. However, its high payout ratios and variable cash flow indicate the need for careful monitoring. As such, SWK is recommended as a 'hold' for investors seeking steady income, provided awareness of possible financial headwinds.
Smart Data Insight
Master the Perfect Entry & Exit for this Stock
Don't leave your profits to chance. Historically, this stock follows specific seasonal patterns that institutional traders use to maximize returns.
- ✅ Identify the "Golden Buying Window"
- ✅ Avoid high-risk correction cycles
- ✅ Backtested data from the last 20+ years