September 29, 2025 a 02:48 am
SWK: Dividend Analysis - Stanley Black & Decker, Inc.
Stanley Black & Decker, Inc., with its robust commitment to dividend payouts, reflects resilience amid market fluctuations. The company showcases a longstanding dividend history, signaling potential stability and reliability for income-focused investors. However, recent financial metrics suggest challenges that may influence future dividend policies. An examination of the company's payout ratios and cash flow efficiency provides further insights into its ability to sustain dividend payments.
📊 Overview
The following table provides a snapshot of Stanley Black & Decker's dividend profile, indicating a solid dividend yield in the industrial sector. This has supported its long-standing tradition of shareholder returns.
| Key Metric | Details |
|---|---|
| Sector | Industrial |
| Dividend yield | 4.59% |
| Current dividend per share | 3.26 USD |
| Dividend history | 41 years |
| Last cut or suspension | None |
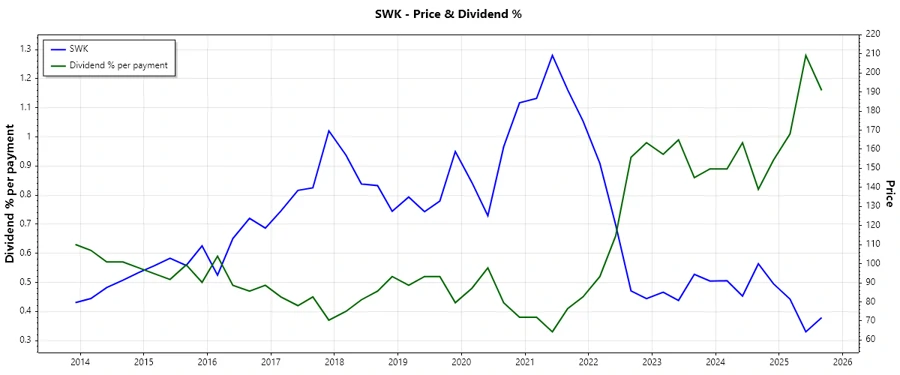
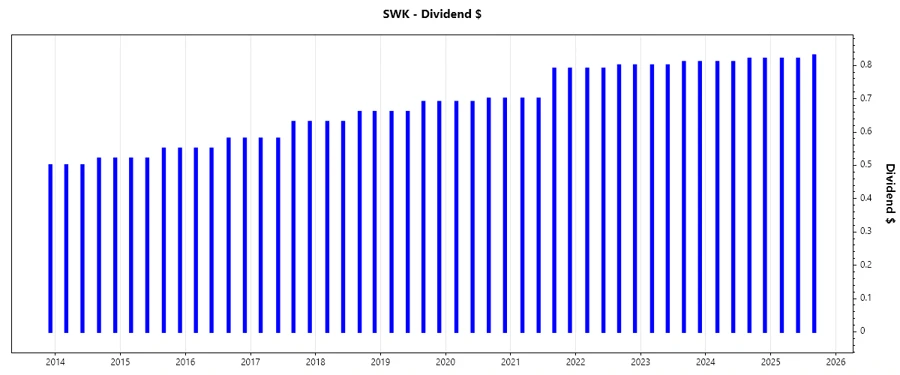
🗣️ Dividend History
Stanley Black & Decker boasts a 41-year history of uninterrupted dividend payments, which underscores its commitment to returning capital to shareholders. This history enhances investor confidence, particularly for those seeking consistent income streams.
| Year | Dividend per Share (USD) |
|---|---|
| 2025 | 2.47 |
| 2024 | 3.26 |
| 2023 | 3.22 |
| 2022 | 3.18 |
| 2021 | 2.98 |
📈 Dividend Growth
Understanding dividend growth is critical as it suggests the company's ability to increase shareholder returns over time. Below shows the growth over three and five years, identifying trends in the company’s financial health.
| Time | Growth |
|---|---|
| 3 years | 3.04% |
| 5 years | 3.84% |
The average dividend growth is 3.84% over 5 years. This shows moderate but steady dividend growth.
✅ Payout Ratio
The payout ratio helps assess the sustainability of dividends relative to earnings and cash flow. High payout ratios may signal potential dividend cuts.
| Key figure | Ratio |
|---|---|
| EPS-based | 122.38% |
| Free cash flow-based | 102.38% |
With an EPS payout ratio of 122.38% and a free cash flow basis of 102.38%, the figures suggest the current dividends might not be sustainable if earnings continue to fall.
💵 Cashflow & Capital Efficiency
Strong cashflow metrics are vital for sustaining dividend payments and funding growth. Evaluation of free cash flow yield and capital utilization ratios highlight these capabilities.
| Metric | 2024 | 2023 | 2022 |
|---|---|---|---|
| Free Cash Flow Yield | 6.21% | 5.80% | -17.88% |
| Earnings Yield | 2.43% | -2.11% | 1.53% |
| CAPEX/Op. Cash Flow | 31.97% | 28.43% | -36.34% |
| Stock-based Comp./Revenue | 0.69% | 0.53% | 0.54% |
| Free Cash Flow / Op. Cash Flow | 68.03% | 71.57% | 136.34% |
Stanley Black & Decker exhibits variable cash flow yields and capital efficiency, pivotal for long-term financial health and potential dividend security.
💳 Balance Sheet & Leverage Analysis
The balance sheet signifies the company’s liquidity and leverage, crucial factors influencing financial stability and ability to meet obligations. Ratios below provide insight into these arenas.
| Metric | 2024 | 2023 | 2022 |
|---|---|---|---|
| Debt-to-Equity | 0.71 | 0.81 | 0.77 |
| Debt-to-Assets | 0.29 | 0.31 | 0.30 |
| Debt-to-Capital | 0.42 | 0.45 | 0.43 |
| Net Debt to EBITDA | 4.49 | 8.54 | 7.49 |
| Current Ratio | 1.30 | 1.19 | 1.22 |
| Quick Ratio | 0.37 | 0.39 | 0.32 |
| Financial Leverage | 2.51 | 2.61 | 2.57 |
The company's leverage ratios reflect moderate financial pressure with an emphasis on maintaining liquidity, critical to sustain operational needs and dividends.
📈 Fundamental Strength & Profitability
Key profitability and margin indicators are instrumental in understanding financial robustness and efficiency. The table below illustrates these averages with a historical perspective.
| Metric | 2024 | 2023 | 2022 |
|---|---|---|---|
| Return on Equity | 3.38% | -3.43% | 1.75% |
| Return on Assets | 1.35% | -1.31% | 0.68% |
| Net Margin | 1.92% | -1.97% | 1.00% |
| EBIT Margin | 4.81% | 1.16% | 2.22% |
| EBITDA Margin | 8.61% | 5.09% | 5.56% |
| Gross Margin | 29.38% | 25.97% | 25.28% |
| R&D to Revenue | 2.14% | 2.29% | 2.11% |
Despite economic challenges, the company's profitability metrics show resilience, pivotal for maintaining dividends and fostering growth.
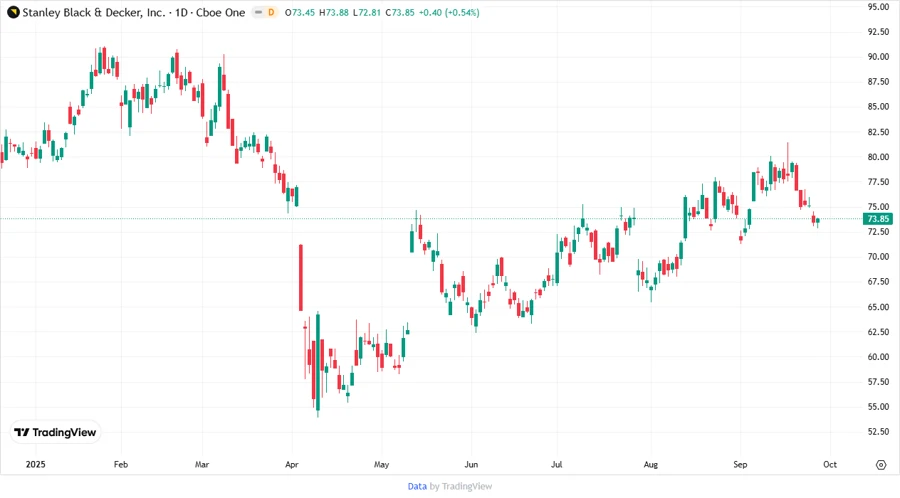
📉 Price Development
📊 Dividend Scoring System
| Criteria | Description | Score |
|---|---|---|
| Dividend yield | Current yield attractiveness | 4 |
| Dividend Stability | History of consistent payments | 5 |
| Dividend growth | Historical growth rate | 3 |
| Payout ratio | Risk of payout sustainability | 2 |
| Financial stability | Balance sheet strength | 3 |
| Dividend continuity | No cuts or suspensions | 5 |
| Cashflow Coverage | Cash flow support for dividends | 3 |
| Balance Sheet Quality | Leverage and liquidity | 3 |
Total Score: 28/40
🗣️ Rating
Overall, Stanley Black & Decker maintains a commendable dividend track record with a favorable yield. Nonetheless, elevated payout ratios and mixed financial metrics warrant cautious optimism. Investors should weigh the potential for stable income against the backdrop of fiscal management and broader market conditions.
Smart Data Insight
Master the Perfect Entry & Exit for this Stock
Don't leave your profits to chance. Historically, this stock follows specific seasonal patterns that institutional traders use to maximize returns.
- ✅ Identify the "Golden Buying Window"
- ✅ Avoid high-risk correction cycles
- ✅ Backtested data from the last 20+ years