August 10, 2025 a 03:31 pm


SWK: Dividend Analysis - Stanley Black & Decker, Inc.
Stanley Black & Decker, Inc. presents a robust dividend profile, highlighted by a historical commitment to dividend payments for over 41 years. Currently yielding 4.75%, the company's dividend strength is underscored by a consistent growth trajectory, making it an appealing choice for dividend-focused investors. However, potential investors should be mindful of its elevated payout ratios, which indicate pressures on sustainability.
Overview 📊
Stanley Black & Decker operates in the Industrial sector, offering a competitive dividend yield at 4.75%, with a current dividend per share of 3.262 USD. The company has maintained a commendable dividend history for 41 years with no recent cuts or suspensions.
| Metric | Value |
|---|---|
| Sector | Industrial |
| Dividend yield | 4.75 % |
| Current dividend per share | 3.262 USD |
| Dividend history | 41 years |
| Last cut or suspension | None |
Dividend History 📜
Stanley Black & Decker showcases a steady dividend payment pattern that spans over decades. Understanding this history helps investors evaluate the company's commitment to return capital to shareholders, which is crucial for reliability and predictability in income generation.
| Year | Dividend per Share (USD) |
|---|---|
| 2025 | 2.47 |
| 2024 | 3.26 |
| 2023 | 3.22 |
| 2022 | 3.18 |
| 2021 | 2.98 |
Dividend Growth 📉
The dividend growth rate is an essential indicator of the company's capacity to increase shareholder distributions over time. Over the last 3 years, growth has been modest at 3.04%, whereas a 5-year perspective reflects a more stable growth rate of 3.84%.
| Time | Growth |
|---|---|
| 3 years | 3.04 % |
| 5 years | 3.84 % |
The average dividend growth is 3.84% over 5 years. This shows moderate but steady dividend growth, providing reassurance to income investors about future cash flow enhancements.
Payout Ratio 🧮
Payout ratios are critical metrics to evaluate the sustainability of dividends. At a high payout based on EPS of 122.38% and 102.38% on Free Cash Flow, these figures are indicative of risks to future dividend maintenance if profits or cash flows falter.
| Key figure | Ratio |
|---|---|
| EPS-based | 122.38 % |
| Free cash flow-based | 102.38 % |
The elevated payout ratios suggest that the company's dividends may not be sustainable in the long term without growth in underlying earnings or free cash flow.
Cashflow & Capital Efficiency 💰
Cash flow analysis tells a compelling story of the company's ability to generate cash to support dividends and investments. Evaluating metrics such as Free Cash Flow Yield and Earnings Yield provides insight into operational efficiency and financial health.
| Metric | 2024 | 2023 | 2022 |
|---|---|---|---|
| Free Cash Flow Yield | 6.21% | 5.80% | -17.88% |
| Earnings Yield | 2.43% | -2.11% | 1.53% |
| CAPEX to Operating Cash Flow | 31.97% | 28.43% | -36.34% |
| Stock-based Compensation to Revenue | 0.69% | 0.53% | 0.54% |
| Free Cash Flow / Operating Cash Flow Ratio | 68.03% | 71.57% | 136.34% |
The analysis reflects moderate cash flow stability with hints of potential growth despite fluctuating cash generation capabilities. However, concerns remain due to high variability in free cash flow across recent years.
Balance Sheet & Leverage Analysis 📊
The balance sheet facilitates assessment of financial standing, revealing the company's leverage and liquidity position. Ratios like Debt-to-Equity and Debt-to-Capital help gauge the extent and manageability of debt.
| Metric | 2024 | 2023 | 2022 |
|---|---|---|---|
| Debt-to-Equity | 0.71 | 0.81 | 0.77 |
| Debt-to-Assets | 0.29 | 0.31 | 0.30 |
| Debt-to-Capital | 0.42 | 0.45 | 0.43 |
| Net Debt to EBITDA | 4.49 | 8.54 | 7.49 |
| Current Ratio | 1.30 | 1.19 | 1.22 |
| Quick Ratio | 0.37 | 0.39 | 0.32 |
| Financial Leverage | 2.51 | 2.61 | 2.57 |
Financial leverage metrics depict moderate leverage, though the rising Net Debt to EBITDA ratio might suggest a growing debt burden that could pose risks under adverse conditions.
Fundamental Strength & Profitability 📊
An analysis of fundamental strengths alongside profitability margins provides insights into the organization's operating effectiveness. Margins and return metrics define the company's capacity to generate profits relative to its size.
| Metric | 2024 | 2023 | 2022 |
|---|---|---|---|
| Return on Equity | 3.38% | -3.43% | 1.75% |
| Return on Assets | 1.35% | -1.31% | 0.68% |
| Net Margin | 1.92% | -1.97% | 1.00% |
| EBIT Margin | 4.81% | 1.16% | 2.22% |
| EBITDA Margin | 8.61% | 5.09% | 5.56% |
| Gross Margin | 29.38% | 25.97% | 25.28% |
| R&D to Revenue | 2.14% | 2.29% | 2.11% |
Stanley Black & Decker's profitability metrics indicate room for improvement. Negative returns in recent years underscore a need for strategic initiatives to bolster profitability.
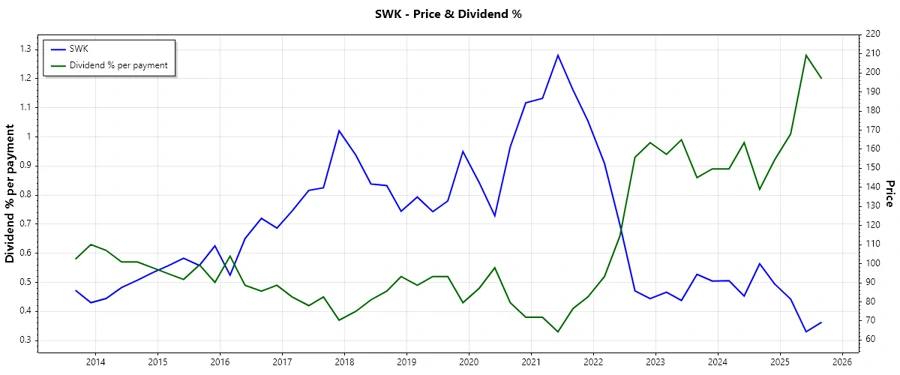
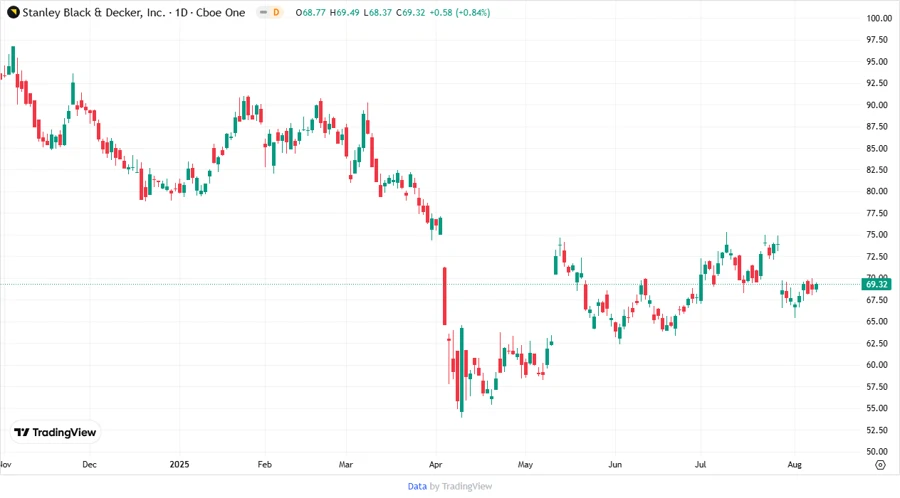
Price Development 📈
Dividend Scoring System 🔍
| Category | Score (1 to 5) | Score Bar |
|---|---|---|
| Dividend yield | 4 | |
| Dividend Stability | 3 | |
| Dividend growth | 3 | |
| Payout ratio | 2 | |
| Financial stability | 3 | |
| Dividend continuity | 4 | |
| Cashflow Coverage | 3 | |
| Balance Sheet Quality | 3 |
Overall Score: 25/40
Rating 🏆
Based on the dividend analysis, Stanley Black & Decker, Inc. maintains a moderate dividend yield with a history of consistency, although marked by elevated payout ratios that suggest caution. It is recommended as a hold for current investors attracted to yield, while prospective investors should weigh the sustainability concerns against potential strategic improvements.
Smart Data Insight
Master the Perfect Entry & Exit for this Stock
Don't leave your profits to chance. Historically, this stock follows specific seasonal patterns that institutional traders use to maximize returns.
- ✅ Identify the "Golden Buying Window"
- ✅ Avoid high-risk correction cycles
- ✅ Backtested data from the last 20+ years