
July 26, 2026 a 10:15 am
SWKS: Fibonacci Analysis - Skyworks Solutions, Inc.
Skyworks Solutions, Inc. has experienced significant volatility in recent months, with emerging trends that necessitate careful analysis. As a prominent player in the semiconductor sector, its products drive a variety of applications ranging from automotive to aerospace. The recent price movement suggests a downward trend, raising questions about potential support levels.
Fibonacci Analysis
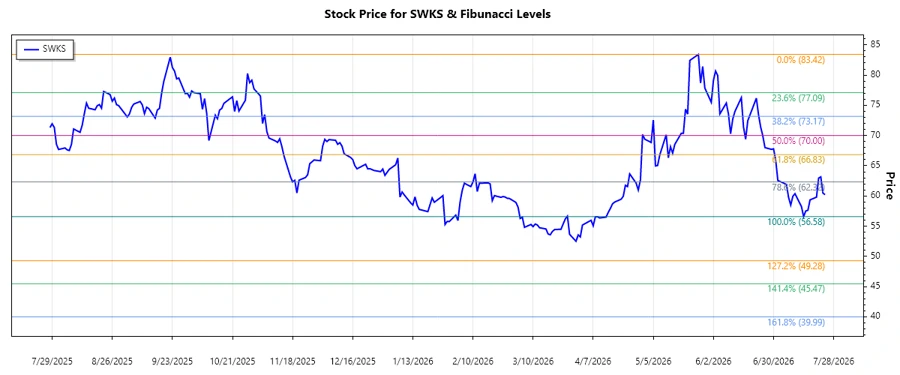
This analysis focuses on the latest downward trend observed from the pricing data. The Fibonacci retracement levels help identify possible support levels where the price could bounce back.
| Detail | Information |
|---|---|
| Start Date | 2026-06-01 |
| End Date | 2026-07-24 |
| High Price (Date) | $83.42 (2026-05-26) |
| Low Price (Date) | $56.58 (2026-07-14) |
Fibonacci Levels
| Level | Price |
|---|---|
| 0.236 | $65.96 |
| 0.382 | $69.03 |
| 0.5 | $71.99 |
| 0.618 | $74.96 |
| 0.786 | $79.05 |
Currently, the stock price is at $60.21, which is below the 0.236 retracement level, indicating it hasn't yet entered any retracement zone. This might suggest weak buying pressure or ongoing bearish sentiment.
The technical interpretation suggests that the $56.58 level could act as potential support. If breached, further downside might be expected.
Conclusion
The analysis highlights potential challenges and opportunities for Skyworks Solutions, Inc. The current price below critical Fibonacci levels reflects ongoing bearish pressure. Analysts might interpret the current scenario as a potential period for consolidation before any significant uptrend. Understanding support levels is crucial for predicting future price movements. A close watch on market sentiment and broader economic factors will be essential to gauge future trends in the stock price.
Smart Data Insight
Master the Perfect Entry & Exit for this Stock
Don't leave your profits to chance. Historically, this stock follows specific seasonal patterns that institutional traders use to maximize returns.
- ✅ Identify the "Golden Buying Window"
- ✅ Avoid high-risk correction cycles
- ✅ Backtested data from the last 20+ years