August 28, 2025 a 07:47 am

SWKS: Dividend Analysis - Skyworks Solutions, Inc.
Skyworks Solutions, Inc. offers a compelling dividend profile with a respectable yield and a robust history of dividend growth extending over 12 years. Its dividend practices are indicative of a stable and potentially rewarding investment for income-focused shareholders. While the EPS payout ratio is elevated, the free cash flow payout ratio suggests sustainability. Investors should, however, remain vigilant regarding the company's earnings capacity to maintain its dividend growth trajectory.
Overview 📊
The current analysis reflects a solid dividend yield of 3.71% alongside a consistent 12-year history, reinforcing Skyworks' commitment to return value to shareholders. The absence of recent dividend cuts or suspensions indicates stability. Despite a current dividend per share of 2.74 USD, vigilance is advised considering the elevated payout based on EPS, which implies caution about future earnings performance.
| Metric | Value |
|---|---|
| Sector | Semiconductors |
| Dividend Yield | 3.71% |
| Current Dividend per Share | 2.74 USD |
| Dividend History | 12 years |
| Last Cut or Suspension | None |
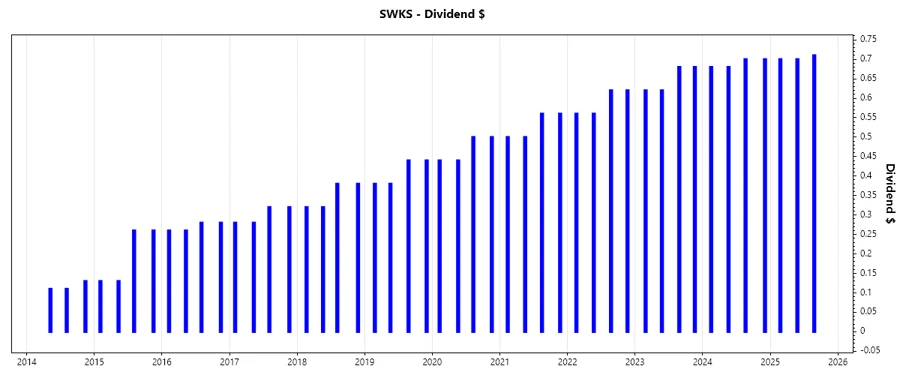
Dividend History 📈
Understanding dividend history is vital, as it underscores a company's ability to generate and distribute consistent value to its shareholders over time. Skyworks' recent history demonstrates steady growth and a reliable payout, making it an attractive proposition for dividend-oriented investors.
| Year | Dividend per Share (USD) |
|---|---|
| 2025 | 2.11 |
| 2024 | 2.76 |
| 2023 | 2.60 |
| 2022 | 2.36 |
| 2021 | 2.12 |
Dividend Growth 🗣️
Dividend growth is a key indicator of a company's future prospects and its willingness to share profits with investors. Over the last three and five years, Skyworks' dividend growth has exhibited moderate expansion, suggesting a commitment to increasing shareholder returns.
| Time | Growth |
|---|---|
| 3 years | 9.19% |
| 5 years | 10.97% |
The average dividend growth is 10.97% over 5 years. This shows moderate but steady dividend growth.
Payout Ratio ⚠️
The payout ratio is crucial in assessing the sustainability of a company's dividend policy. Skyworks showcases a contrasting scenario with an EPS-based payout ratio of 103.84%, indicating potential strain on earnings, whereas the FCF-based ratio at 30.50% suggests more sustainable dividend coverage.
| Key figure | Ratio |
|---|---|
| EPS-based | 103.84% |
| Free cash flow-based | 30.50% |
Cashflow & Capital Efficiency ✅
Cash flow and capital efficiency metrics are fundamental in judging a company's financial health. Skyworks exhibits commendable free cash flow yields and capital management. The low net debt to EBITDA ratio further amplifies its financial attributes.
| Metric | 2022 | 2023 | 2024 |
|---|---|---|---|
| Free Cash Flow Yield | 6.61% | 10.31% | 10.54% |
| Earnings Yield | 9.21% | 6.25% | 3.77% |
| CAPEX to Operating Cash Flow | 35.78% | 12.72% | 8.60% |
| Stock-based Compensation to Revenue | 3.56% | 3.88% | 4.32% |
| Free Cash Flow / Operating Cash Flow Ratio | 0.64 | 0.87 | 0.91 |
The combination of strong cash flow yields and prudent capital deployment underscores Skyworks' ability to sustain dividend payouts while investing for growth.
Balance Sheet & Leverage Analysis 📉
Balance sheet analysis helps assess a company's leverage and risk profile. Skyworks' low debt levels relative to equity and assets render it financially stable, mitigating risk and supporting long-term operational flexibility.
| Metric | 2022 | 2023 | 2024 |
|---|---|---|---|
| Debt-to-Equity | 0.44 | 0.25 | 0.19 |
| Debt-to-Assets | 0.27 | 0.18 | 0.14 |
| Debt-to-Capital | 0.31 | 0.20 | 0.16 |
| Net Debt to EBITDA | 0.83 | 0.45 | -0.15 |
| Current Ratio | 2.63 | 3.33 | 5.54 |
| Quick Ratio | 1.64 | 2.15 | 4.24 |
Skyworks demonstrates a strong balance sheet with minimal leverage, ensuring flexibility and resilience, critical for weathering financial challenges and supporting growth initiatives.
Fundamental Strength & Profitability 📈
A strong financial foundation is pivotal for sustaining both growth and profitability. Skyworks' margins and returns denote robust fundamental health. Its R&D spending fosters innovation, crucial for maintaining a competitive edge.
| Metric | 2022 | 2023 | 2024 |
|---|---|---|---|
| Return on Equity | 23.32% | 16.16% | 9.41% |
| Return on Assets | 14.37% | 11.66% | 7.20% |
| Margins: Net | 23.25% | 20.59% | 14.27% |
| Margins: EBIT | 27.79% | 23.95% | 16.57% |
| Margins: EBITDA | 40.37% | 36.81% | 26.77% |
Skyworks' profitability ratios reveal efficient operations and cost management, enhancing shareholder value and indicating a strong competitive standing.
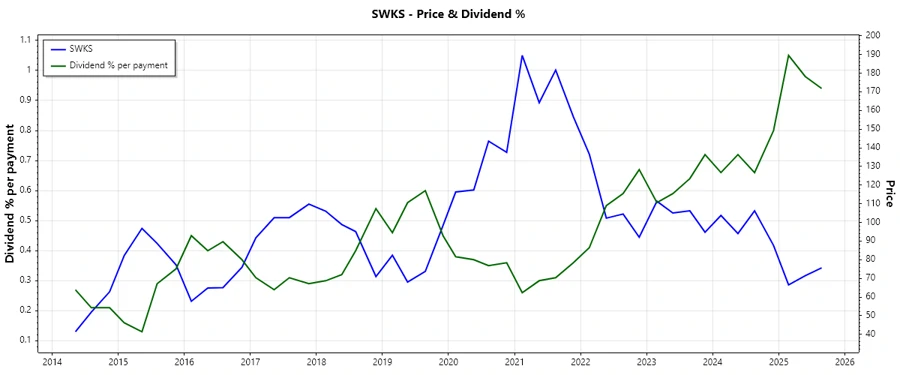
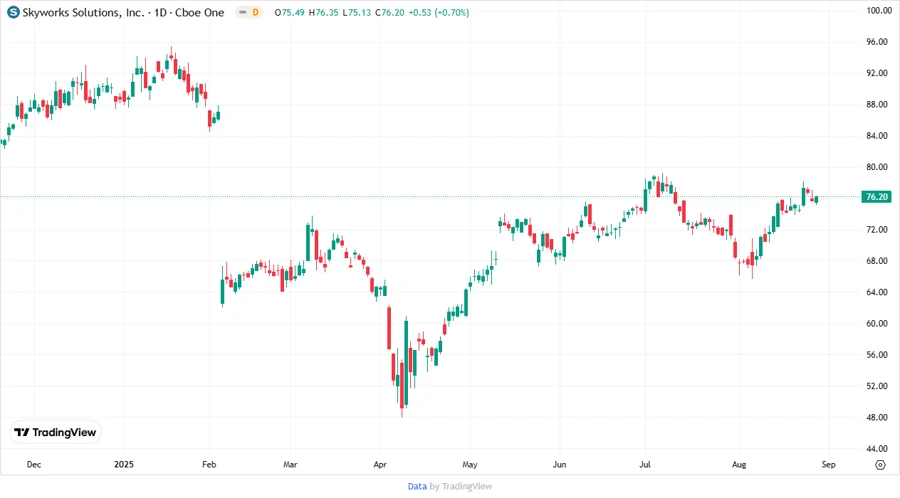
Price Development 💹
Dividend Scoring System 💯
| Category | Score | Graph |
|---|---|---|
| Dividend yield | 4 / 5 | |
| Dividend Stability | 5 / 5 | |
| Dividend growth | 4 / 5 | |
| Payout ratio | 3 / 5 | |
| Financial stability | 5 / 5 | |
| Dividend continuity | 5 / 5 | |
| Cashflow Coverage | 4 / 5 | |
| Balance Sheet Quality | 5 / 5 |
Total Score: 35 / 40
Rating 🏆
Skyworks Solutions, Inc. receives a robust rating based on its exemplary dividend history, solid balance sheet, and meticulous financial management. Although its EPS-based payout ratio merits close supervision, overall financial stability and committed dividend growth provide a favorable outlook for prospective and existing investors, suggesting continued moderate yet steady income potential from dividends.
Smart Data Insight
Master the Perfect Entry & Exit for this Stock
Don't leave your profits to chance. Historically, this stock follows specific seasonal patterns that institutional traders use to maximize returns.
- ✅ Identify the "Golden Buying Window"
- ✅ Avoid high-risk correction cycles
- ✅ Backtested data from the last 20+ years