January 28, 2026 a 05:15 am

STZ: Fibonacci Analysis - Constellation Brands, Inc.
Constellation Brands, Inc. (STZ) has shown strong resilience over the recent months. Despite fluctuations, there is a clear impression of recovery shown by an upward momentum from late 2025 into early 2026. This could indicate potential opportunities for investors if the positive trend continues. However, investors should watch for any signs of market saturation or increased competition, which could affect future performance.
Fibonacci Analysis
| Parameter | Details |
|---|---|
| Trend Start Date | 2025-11-06 |
| Trend End Date | 2026-01-27 |
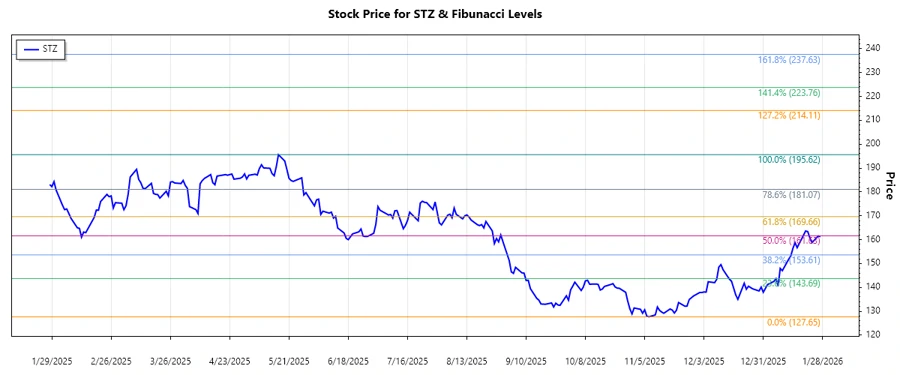
| Highest Price and Date | $195.62 on 2025-05-16 |
| Lowest Price and Date | $127.65 on 2025-11-07 |
| Fibonacci Level | Price Level |
|---|---|
| 0.236 | $146.98 |
| 0.382 | $156.28 |
| 0.5 | $161.64 |
| 0.618 | $166.99 |
| 0.786 | $176.34 |
Current market price indicates that the stock is in the 0.5 Fibonacci retracement zone. This suggests a potential support price, where the market could reverse and continue an upward trend.
Technically, if the price remains above the 0.5 level, investors could view this as a potential support level and consider buying opportunities. However, a failure to maintain above this level could signal further downside risk.
Conclusion
The upward trend in STZ stock is promising, reflecting improving investor confidence. The current price position relative to the Fibonacci levels suggests potential support at the 0.5 retracement, indicating a likely continuation of the upward trend. However, market dynamics such as changes in consumer preferences and regulatory impacts should be carefully monitored. The technical positioning provides an attractive opportunity for value-oriented investors, balancing growth prospects with inherent risks. As a technical analyst, keeping an eye on the world economic indicators can provide clues on the possible macroeconomic impacts on STZ's performance.