March 01, 2026 a 11:31 am
STZ: Dividend Analysis - Constellation Brands, Inc.
Constellation Brands, Inc. presents a moderate dividend profile characterized by steady growth and reliable payouts over the past 12 years. The absence of recent dividend cuts or suspensions underlines the company's commitment to rewarding its shareholders. Some financial metrics suggest areas of leverage management but overall, the dividend is well-covered by earnings and cash flows.
📊 Overview
Constellation Brands operates within a competitive sector, showcasing a dividend yield of 2.64%, which is supported by a current dividend per share of $4.03. The company has maintained a consistent dividend history over the past 12 years without any cuts or suspensions, reflecting robustness in its dividend policy.
| Metric | Value |
|---|---|
| Sector | Beverages |
| Dividend Yield | 2.64% |
| Current Dividend per Share | 4.03 USD |
| Dividend History | 12 years |
| Last Cut or Suspension | None |
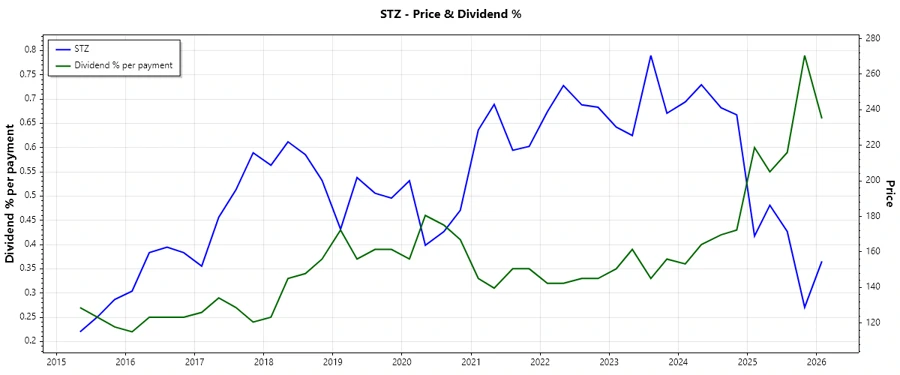
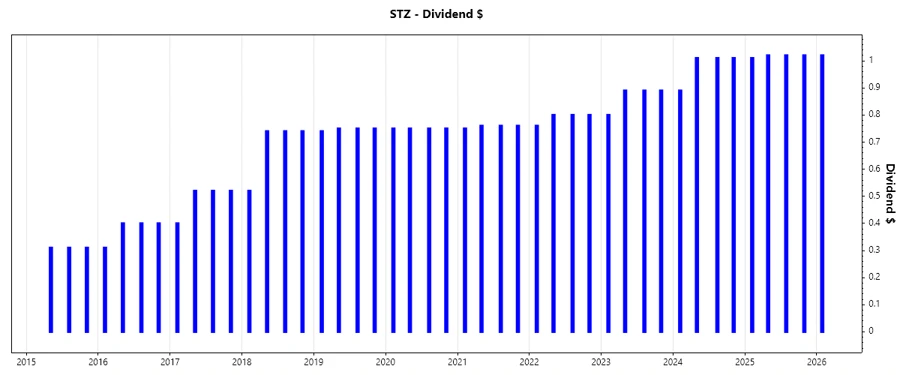
📈 Dividend History
Understanding a company's dividend history can provide insights into the consistency and reliability of its income distribution. Constellation Brands has shown a steady rise in dividends over recent years, underscoring resilience and management's commitment to shareholder returns.
| Year | Dividend per Share (USD) |
|---|---|
| 2026 | 1.02 |
| 2025 | 4.07 |
| 2024 | 3.92 |
| 2023 | 3.47 |
| 2022 | 3.16 |
📉 Dividend Growth
Dividend growth is a crucial indicator of a company's potential to increase shareholder value over time. Constellation Brands has displayed moderate growth rates, with dividends expanding at 8.80% over three years and 6.29% over five years.
| Time | Growth |
|---|---|
| 3 years | 8.80% |
| 5 years | 6.29% |
The average dividend growth is 6.29% over 5 years. This shows moderate but steady dividend growth.
✅ Payout Ratio
Payout ratios are vital for understanding how comfortably a company can support its dividends with profits and cash flow. The payout ratios based on EPS and free cash flow for Constellation Brands stand at 63.42% and 39.84%, respectively, indicating a balanced approach to dividend distributions.
| Key figure | Ratio |
|---|---|
| EPS-based | 63.42% |
| Free cash flow-based | 39.84% |
The EPS-based payout ratio of 63.42% shows a reliable coverage, while the 39.84% free cash flow-based ratio suggests strong management of cash flows.
🗣️ Cashflow & Capital Efficiency
Examining cash flow and capital efficiency metrics allows investors to assess the company’s ability to generate cash and reinvest it effectively. Key areas include free cash flow yield, earnings yield, and the proportion of CAPEX to operating cash flow, which highlight operational effectiveness and resource allocation.
| Metric | 2023 | 2024 | 2025 |
|---|---|---|---|
| Free Cash Flow Yield | 3.99% | 3.32% | 6.08% |
| Earnings Yield | -0.16% | 3.79% | -0.26% |
| CAPEX to Operating Cash Flow | 37.56% | 45.65% | 38.52% |
| Stock-based Compensation to Revenue | 0.72% | 0.64% | 0.71% |
| Free Cash Flow / Operating Cash Flow Ratio | 62.44% | 54.35% | 61.48% |
Constellation Brands demonstrates robust cash flow generation and adequate capital efficiency, supported by favorable yield metrics and investment strategies.
🗓️ Balance Sheet & Leverage Analysis
An examination of the balance sheet provides insights into Constellation Brands' financial position, particularly concerning leverage and liquidity. Its debt-to-equity and leverage ratios reflect its capital structure decisions.
| Metric | 2023 | 2024 | 2025 |
|---|---|---|---|
| Debt-to-Equity | 1.54 | 1.29 | 1.76 |
| Debt-to-Assets | 52.55% | 48.88% | 55.95% |
| Debt-to-Capital | 60.64% | 56.31% | 63.77% |
| Net Debt to EBITDA | 10.98 | 4.02 | 15.39 |
| Current Ratio | 1.18 | 1.19 | 0.92 |
| Quick Ratio | 0.54 | 0.53 | 0.56 |
| Financial Leverage | 2.93 | 2.64 | 3.15 |
The financial data suggests that while Constellation Brands operates with significant leverage, it maintains a reasonable coverage and liquidity framework. However, close monitoring of debt levels remains prudent.
🏆 Fundamental Strength & Profitability
Performance indicators such as return rates and profit margins are fundamental to assessing Constellation Brands' profitability and operational efficiency.
| Metric | 2023 | 2024 | 2025 |
|---|---|---|---|
| Return on Equity | -0.84% | 17.73% | -1.18% |
| Return on Assets | -0.29% | 6.72% | -0.38% |
| Net Margin | -0.75% | 17.34% | -0.80% |
| EBIT Margin | 8.27% | 26.67% | 3.29% |
| EBITDA Margin | 12.36% | 30.97% | 7.67% |
| Gross Margin | 50.90% | 49.28% | 50.96% |
| R&D to Revenue | 0% | 0% | 0% |
Despite periods of negative profitability, the overall financial framework points to manageable profitability with room for improvement. Focus on improving core operational efficiencies could be beneficial.
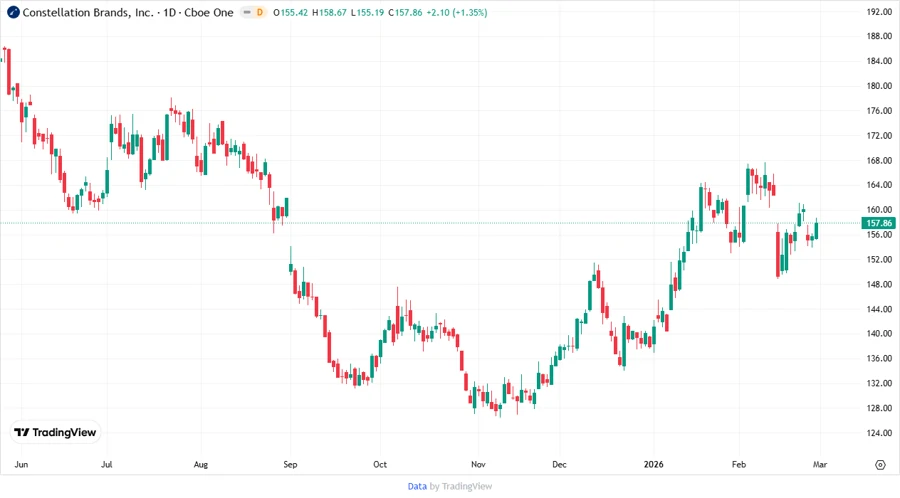
📉 Price Development
🔍 Dividend Scoring System
This customised scoring system evaluates critical criteria relevant to Constellation Brands' dividend viability.
| Criteria | Score | Score Bar |
|---|---|---|
| Dividend Yield | 3 | |
| Dividend Stability | 4 | |
| Dividend Growth | 4 | |
| Payout Ratio | 3 | |
| Financial Stability | 3 | |
| Dividend Continuity | 5 | |
| Cashflow Coverage | 4 | |
| Balance Sheet Quality | 3 |
Total Score: 29/40
🎯 Rating
Constellation Brands, Inc. demonstrates a solid dividend profile with moderate growth and consistent payouts. While financial stability and leverage need monitoring, the overall outlook for sustained dividends remains positive, making it a viable option for income-focused investors looking for stable returns.