February 14, 2026 a 07:31 am
STZ: Dividend Analysis - Constellation Brands, Inc.
Constellation Brands, Inc., exhibits a stable and reliable dividend profile. The company's commitment to shareholder returns is demonstrated by its consistent dividend history of 12 years without suspensions. The current dividend yield of approximately 2.64% is an attractive feature for income-seeking investors amidst a moderate growth backdrop. However, investors should remain vigilant of the higher payout ratios and leverage, which indicate potential risk to cash flows.
Overview 📊
The following overview provides insight into the dividend and sector characteristics of Constellation Brands, Inc.
| Metric | Data |
|---|---|
| Sector | Consumer Staples |
| Dividend Yield | 2.64% |
| Current Dividend Per Share | 4.03 USD |
| Dividend History (Years) | 12 Years |
| Last Cut or Suspension | None |
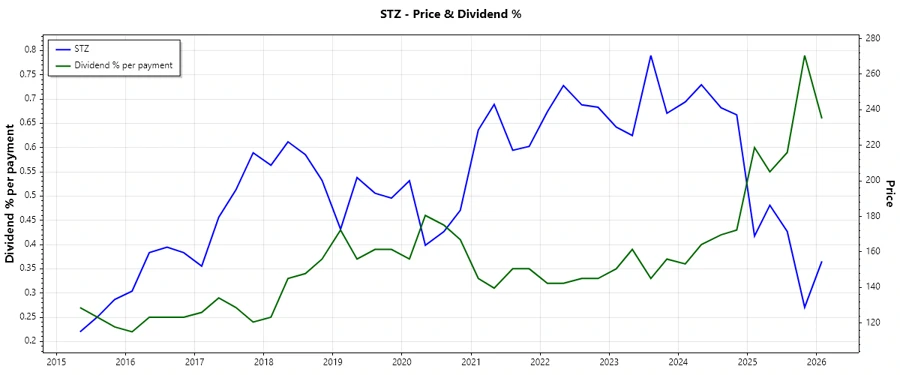
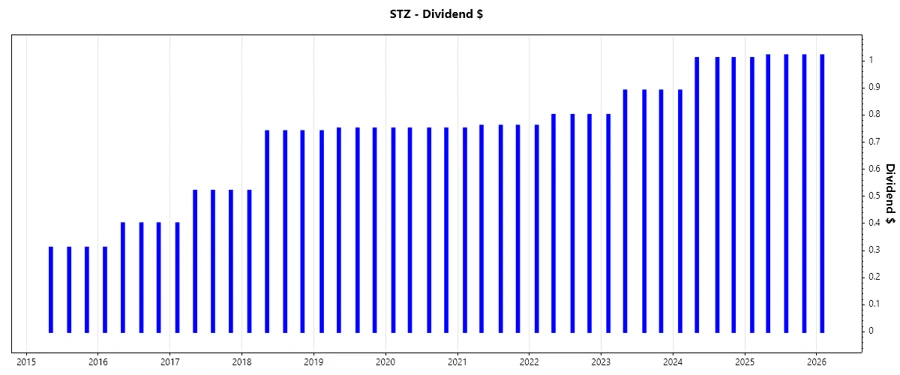
Dividend History 🗣️
Analyzing historical dividend payments provides clarity on a company's commitment to shareholder returns and its financial stability over time. Regular and sustainable dividend payouts can enhance investor confidence and attract a loyal shareholder base.
| Year | Dividend Per Share (USD) |
|---|---|
| 2026 | 1.02 |
| 2025 | 4.07 |
| 2024 | 3.92 |
| 2023 | 3.47 |
| 2022 | 3.16 |
Dividend Growth 📈
Assessing the rate of dividend growth is crucial for determining the potential future value for long-term oriented investors. It reflects a company's earnings health and its strategy for returning capital to shareholders.
| Time | Growth |
|---|---|
| 3 years | 0.09% |
| 5 years | 0.06% |
The average dividend growth is 0.06% over 5 years. This shows moderate but steady dividend growth.
Payout Ratio ✅
The payout ratio is a key determinant of dividend sustainability. It reflects the proportion of earnings or cash flow allocated to dividends, indicating the company’s capacity to maintain or increase payouts.
| Key figure | Ratio |
|---|---|
| EPS-based | 63.42% |
| Free cash flow-based | 39.84% |
The payout ratio of 63.42% (EPS) suggests a moderately high allocation of earnings to dividends which could pressure financial flexibility, whereas 39.84% (FCF) demonstrates a more manageable level of cash commitment.
Cashflow & Capital Efficiency 💰
Understanding cash flow metrics and capital efficiency allows investors to gauge the company's operational and financial health. These metrics provide insight into profitability, cash availability, and efficient resource allocation.
| Metric | 2023 | 2024 | 2025 |
|---|---|---|---|
| Free Cash Flow Yield | 3.99% | 3.32% | 6.09% |
| Earnings Yield | -0.16% | 3.79% | -0.25% |
| CAPEX to Operating Cash Flow | 37.56% | 45.65% | 38.52% |
| Stock-based Compensation to Revenue | 0.72% | 0.64% | 0.71% |
| Free Cash Flow / Operating Cash Flow Ratio | 62.44% | 54.35% | 61.48% |
The financial stability is well-reflected through the efficient capital deployment and strong cash flow management, though the negative earnings yield poses some risks.
Balance Sheet & Leverage Analysis ⚖️
A company's balance sheet metrics and leverage ratios provide insights into its financial resilience and capacity to meet obligations. High leverage may signal heightened risk, whereas lower debt levels often denote financial strength.
| Metric | 2023 | 2024 | 2025 |
|---|---|---|---|
| Debt-to-Equity | 1.54 | 1.29 | 1.76 |
| Debt-to-Assets | 0.53 | 0.49 | 0.56 |
| Debt-to-Capital | 0.61 | 0.56 | 0.64 |
| Net Debt to EBITDA | 10.98 | 4.02 | 15.39 |
| Current Ratio | 1.18 | 1.19 | 0.92 |
| Quick Ratio | 0.54 | 0.53 | 0.56 |
The leverage ratios highlight a significant level of indebtedness, potentially limiting financial flexibility. However, short-term liquidity remains adequate.
Fundamental Strength & Profitability 📉
Evaluating fundamental strength from profit margin and return ratios offers insight into a company's profitability while assessing operational efficiency and competitive standing.
| Metric | 2023 | 2024 | 2025 |
|---|---|---|---|
| Return on Equity | -0.84% | 17.73% | -1.18% |
| Return on Assets | -0.29% | 6.72% | -0.38% |
| Net Profit Margin | -0.75% | 17.34% | -0.80% |
| EBIT Margin | 8.27% | 26.66% | 3.29% |
| EBITDA Margin | 12.36% | 30.97% | 7.67% |
| Gross Margin | 50.90% | 49.28% | 50.96% |
| Research & Development to Revenue | 0% | 0% | 0% |
Fundamental analysis reveals volatility with periods of negative profitability. Attention should be focused on increasing operational margins to rebuild profitability.
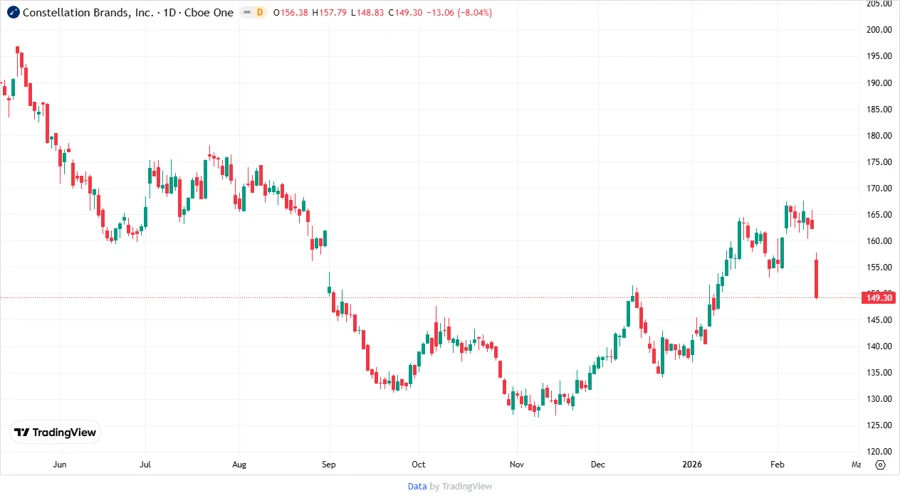
Price Development 🏷️
Dividend Scoring System 🔢
| Category | Score | Score bar |
|---|---|---|
| Dividend Yield | 4 | |
| Dividend Stability | 4 | |
| Dividend Growth | 3 | |
| Payout Ratio | 3 | |
| Financial Stability | 2 | |
| Dividend Continuity | 4 | |
| Cashflow Coverage | 3 | |
| Balance Sheet Quality | 2 |
Total Score: 25/40
Rating 👍
Constellation Brands, Inc. presents a mixed dividend and financial profile, with strong dividend continuity but significant leverage. The overall recommendation is a hold, as stability in cash flows and operational improvements are needed to support dividend growth and enhance future returns.