November 14, 2025 a 07:31 am

STZ: Dividend Analysis - Constellation Brands, Inc.
The dividend profile of Constellation Brands showcases a carefully balanced approach. As a company, it continues to provide a stable dividend yield along with moderate growth over the years. Investors may note that the payout ratios are maintained at a sustainable level, supporting the company's commitment to distributing value. However, vigilance is advised due to the fluctuations in financial stability metrics over recent fiscal periods.
📊 Overview
The following table provides an overview of key dividend-related metrics for Constellation Brands:
| Key Metric | Value |
|---|---|
| Sector | Beverages |
| Dividend yield | 3.16 % |
| Current dividend per share | 4.03 USD |
| Dividend history | 11 years |
| Last cut or suspension | None |
📉 Dividend History
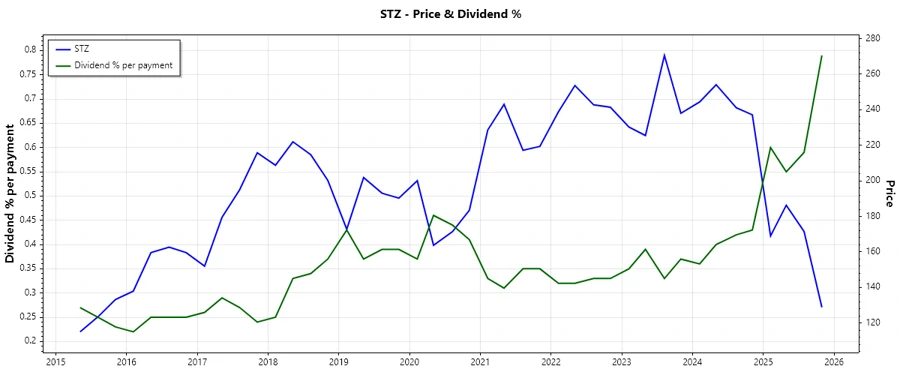
Understanding the dividend history is crucial as it indicates the company’s dedication to returning profits to shareholders consistently. The following chart and table illustrate recent dividend payments:
| Year | Dividend per Share (USD) |
|---|---|
| 2025 | 4.07 |
| 2024 | 3.92 |
| 2023 | 3.47 |
| 2022 | 3.16 |
| 2021 | 3.03 |
📈 Dividend Growth
Reviewing the dividend growth rate provides insights into the future potential of dividend increases. Monitoring this can indicate how the company’s earnings might grow over time:
| Time | Growth |
|---|---|
| 3 years | 8.96 % |
| 5 years | 5.57 % |
The average dividend growth is 5.57 % over 5 years. This shows moderate but steady dividend growth.
✅ Payout Ratio
Payout ratios provide a measure of how well earnings support dividends, which is important for assessing dividend sustainability:
| Key Figure | Ratio |
|---|---|
| EPS-based | 57.99 % |
| Free cash flow-based | 38.22 % |
The EPS-based payout ratio of 57.99 % indicates a cautious approach, maintaining a balance that supports sustainability while allowing for reinvestment opportunities. Meanwhile, the FCF-based payout of 38.22 % suggests a comfortable coverage of dividends by cash flows.
🚀 Cashflow & Capital Efficiency
The cash flow and capital efficiency metrics are crucial indicators of operational effectiveness and the ability to reinvest in growth initiatives:
| Fiscal Year | 2025 | 2024 | 2023 |
|---|---|---|---|
| Free Cash Flow Yield | 6.08 % | 3.32 % | 4.00 % |
| Earnings Yield | -0.26 % | 3.79 % | -0.16 % |
| CAPEX to Operating Cash Flow | 38.52 % | 45.65 % | 37.56 % |
| Stock-based Compensation to Revenue | 0.71 % | 0.64 % | 0.72 % |
| Free Cash Flow/Operating Cash Flow Ratio | 61.48 % | 54.35 % | 62.44 % |
Assessing the cash flow stability and capital efficiency, Constellation Brands demonstrates a solid Free Cash Flow Yield and efficient use of CAPEX relative to operating cash flow. This reflects prudent management of resources and a commitment to shareholder returns.
💼 Balance Sheet & Leverage Analysis
Analyzing balance sheet strength provides insights into the company’s financial resilience and debt management practices:
| Fiscal Year | 2025 | 2024 | 2023 |
|---|---|---|---|
| Debt-to-Equity | 176 % | 129 % | 154 % |
| Debt-to-Assets | 56 % | 49 % | 53 % |
| Debt-to-Capital | 64 % | 56 % | 61 % |
| Net Debt to EBITDA | 15.39 | 4.02 | 10.98 |
| Current Ratio | 0.92 | 1.19 | 1.18 |
| Quick Ratio | 0.56 | 0.53 | 0.54 |
The leverage analysis reveals a strong currency range with manageable Debt-to-Equity and stable Debt-to-Assets ratios. The Net Debt to EBITDA ratio highlights substantial room for improving financial leverage, with a mindful approach towards liquidity and solvency.
🔍 Fundamental Strength & Profitability
Examining fundamental strength and profitability ratios helps in understanding the efficiency and profitability of operations:
| Fiscal Year | 2025 | 2024 | 2023 |
|---|---|---|---|
| Return on Equity | -1.18 % | 17.73 % | -0.84 % |
| Return on Assets | -0.38 % | 6.72 % | -0.29 % |
| Margins: Net, EBIT, EBITDA, Gross | Neg., 3.29 %, 7.67 %, 50.96 % | 17.34 %, 26.66 %, 30.96 %, 49.28 % | Neg., 8.27 %, 12.36 %, 50.90 % |
The profitability metrics of Constellation Brands reveal a mixed outlook, with a solid performance in favorable fiscal periods. Return on Equity and Asset returns vary considerably, highlighting the importance of ongoing strategic improvements in profit generation.
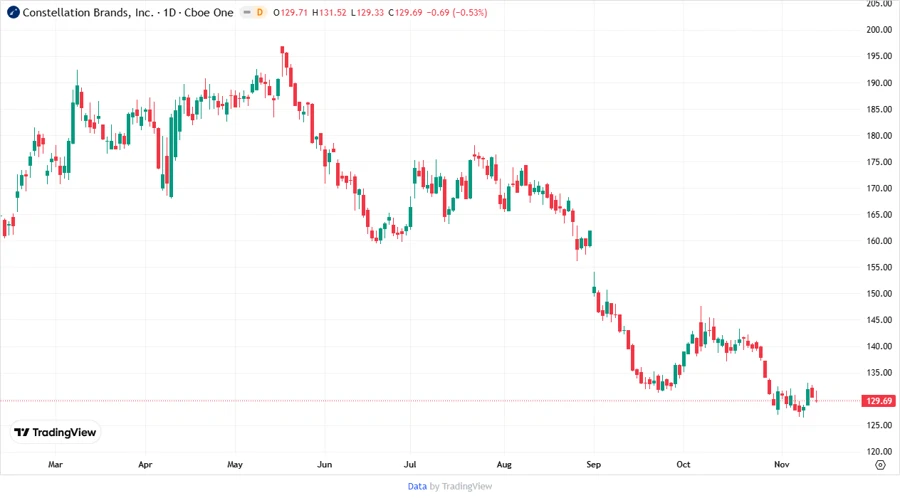
📊 Price Development
📏 Dividend Scoring System
| Category | Score | Score Bar |
|---|---|---|
| Dividend yield | 4 | |
| Dividend Stability | 4 | |
| Dividend growth | 3 | |
| Payout ratio | 5 | |
| Financial stability | 3 | |
| Dividend continuity | 4 | |
| Cashflow Coverage | 3 | |
| Balance Sheet Quality | 4 |
Total Score: 30/40
⭐ Rating
Constellation Brands, Inc. is a stable dividend-paying entity with commendable growth and sustainability metrics. The moderate dividend yield combines with robust payout ratios to offer an attractive profile for income-focused investors. However, potential buyers should stay informed about fluctuations in financial ratios and leverage metrics. It is advised to consider this security for diversified portfolios looking for consistent income generation.
Smart Data Insight
Master the Perfect Entry & Exit for this Stock
Don't leave your profits to chance. Historically, this stock follows specific seasonal patterns that institutional traders use to maximize returns.
- ✅ Identify the "Golden Buying Window"
- ✅ Avoid high-risk correction cycles
- ✅ Backtested data from the last 20+ years