August 16, 2025 a 03:32 pm


STZ: Dividend Analysis - Constellation Brands, Inc.
Constellation Brands, Inc. exhibits a dividend yield of approximately 2.37%, which reflects a moderate income opportunity for investors. With a solid history of 11 years without any recent cuts or suspensions, this assures a relatively stable income stream. Despite negative EPS payout ratios, the company's reliance on Free Cash Flow for dividends provides a cushion. This analysis delves into the fiscal nuances that influence the sustainability and growth of its dividend policy.
📊 Overview
This section provides insight into the vital dividend metrics of Constellation Brands, crucial for evaluating income reliability and growth potential.
| Metric | Value |
|---|---|
| Sector | Consumer Goods |
| Dividend yield | 2.37% |
| Current dividend per share | 4.03 USD |
| Dividend history | 11 years |
| Last cut or suspension | None |
📈 Dividend History
Understanding the historical payout of dividends is fundamental to gauging the company's commitment to rewarding shareholders and its capability to do so sustainably.
| Year | Dividend per Share (USD) |
|---|---|
| 2025 | 3.05 |
| 2024 | 3.92 |
| 2023 | 3.47 |
| 2022 | 3.16 |
| 2021 | 3.03 |
📈 Dividend Growth
The growth of dividends provides a firm indicator of the company's financial health and potential future value for investors.
| Time | Growth |
|---|---|
| 3 years | 8.96% |
| 5 years | 5.57% |
The average dividend growth is 5.57% over 5 years. This shows moderate but steady dividend growth, which is crucial for long-term income stability.
📉 Payout Ratio
Payout ratios are instrumental in determining how much earnings and cash flow are distributed as dividends, affecting the reinvestment in operations.
| Key Figure | Ratio |
|---|---|
| EPS-based | -162.10% |
| Free cash flow-based | 34.38% |
Negative EPS-based payout indicates possible earnings pressure, whereas a FCF-based payout is within a sustainable range, encouraging continuous dividend support.
🗣️ Cashflow & Capital Efficiency
Efficient capital expenditure relative to cash flows is crucial for sustainability, particularly regarding dividends.
| Year | 2025 | 2024 | 2023 |
|---|---|---|---|
| Free Cash Flow Yield | 0.061 | 0.033 | 0.040 |
| Earnings Yield | -0.003 | 0.038 | -0.001 |
| CAPEX to Operating Cash Flow | 0.385 | 0.457 | 0.376 |
| Stock-based Compensation to Revenue | 0.007 | 0.006 | 0.007 |
| Free Cash Flow / Operating Cash Flow Ratio | 61.48% | 54.35% | 62.44% |
Stable cash flows and capital efficiency attract investors, even amid slight earnings volatility. The consistently positive free cash flow yield reinforces this perspective.
📉 Balance Sheet & Leverage Analysis
Balance sheet ratios guide financial health assessments, focusing on leverage and liquidity.
| Year | 2025 | 2024 | 2023 |
|---|---|---|---|
| Debt-to-Equity | 1.760 | 1.289 | 1.481 |
| Debt-to-Assets | 0.559 | 0.489 | 0.505 |
| Debt-to-Capital | 0.638 | 0.563 | 0.597 |
| Net Debt to EBITDA | 15.56 | 4.02 | 9.80 |
| Current Ratio | 1.067 | 1.187 | 1.178 |
| Quick Ratio | 0.565 | 0.526 | 0.538 |
| Financial Leverage | 3.146 | 2.637 | 2.931 |
The relatively high leverage ratios could indicate potential risk, balanced by a strong current ratio ensuring liquidity and ability to service debt obligations.
✅ Fundamental Strength & Profitability
Profitability ratios validate operational efficiency and consistency, underpinning the financial structure supporting dividends.
| Year | 2025 | 2024 | 2023 |
|---|---|---|---|
| Return on Equity | -0.012 | 0.177 | -0.005 |
| Return on Assets | -0.004 | 0.067 | -0.002 |
| Margins: Net | -0.008 | 0.173 | -0.004 |
| Margins: EBIT | 0.032 | 0.267 | 0.083 |
| Margins: EBITDA | 0.076 | 0.310 | 0.133 |
| Margins: Gross | 0.521 | 0.504 | 0.505 |
| R&D to Revenue | 0.000 | 0.000 | 0.000 |
The operational performance shows variability, posing challenges to consistent profitability, emphasizing the necessity for management to equilibrate operational strategies.
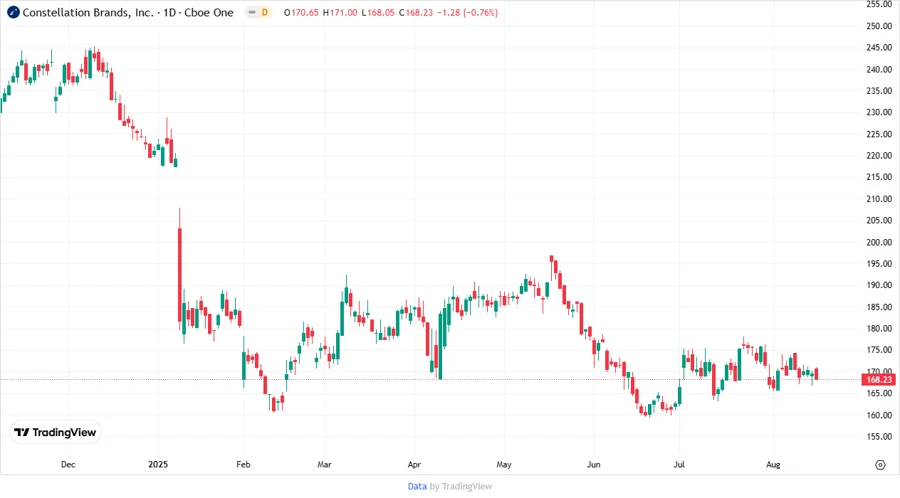
📈 Price Development
🗣️ Dividend Scoring System
| Criteria | Value | Score |
|---|---|---|
| Dividend yield | 2.37% | |
| Dividend Stability | 11 years | |
| Dividend growth | 5.57% over 5 years | |
| Payout ratio | FCF 34.38% | |
| Financial stability | High leverage | |
| Dividend continuity | No suspension | |
| Cashflow Coverage | Sufficient | |
| Balance Sheet Quality | Moderate |
Total Score: 49/80
✅ Rating
Constellation Brands, Inc. presents a dividend opportunity with moderate yield and growth against a backdrop of high leverage. While dividend continuity is noteworthy, potential investors should weigh financial stability risks. A cautious buy for income-oriented portfolios, with vigilance on leverage and operational consistency.
Smart Data Insight
Master the Perfect Entry & Exit for this Stock
Don't leave your profits to chance. Historically, this stock follows specific seasonal patterns that institutional traders use to maximize returns.
- ✅ Identify the "Golden Buying Window"
- ✅ Avoid high-risk correction cycles
- ✅ Backtested data from the last 20+ years