June 22, 2025 a 07:46 am

STZ: Dividend Analysis - Constellation Brands, Inc.
Constellation Brands, Inc., with its robust dividend yield and strong dividend history, presents itself as a formidable player in the dividend-paying arena. By maintaining a steady increment in dividends over the years, it showcases a commitment to shareholder value. However, investors should be cautious of the relatively high EPS payout ratio, indicating a substantial portion of net income allocated to dividends.
📊 Overview
Constellation Brands, Inc.'s key dividend metrics highlight the company's strategic focus on rewarding its shareholders. However, careful attention should be paid to the financial ratios that may affect the sustainability of these payouts.
| Key Metrics | Details |
|---|---|
| Sector | Beverages |
| Dividend Yield | 2.17% |
| Current Dividend per Share | 4.03 USD |
| Dividend History | 11 years |
| Last Cut or Suspension | None |
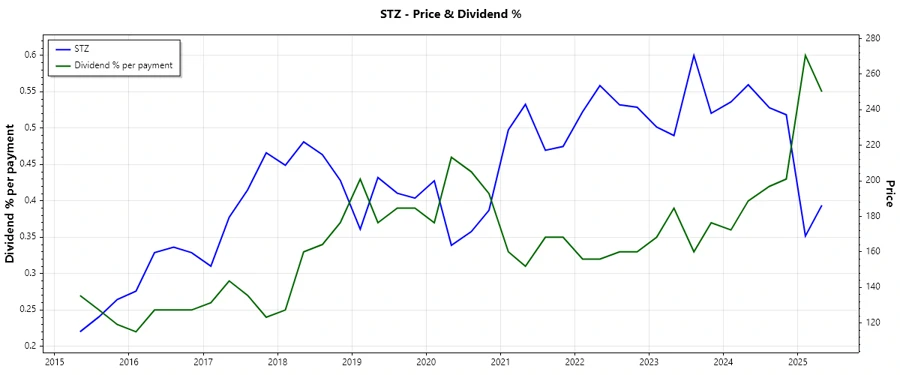
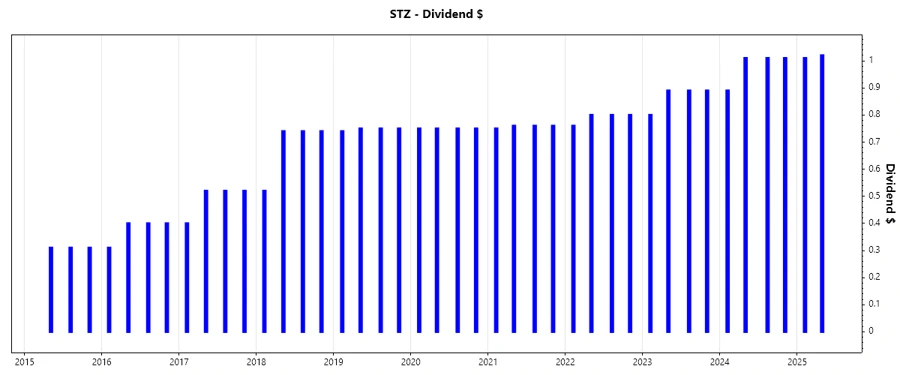
🗣️ Dividend History
Examining the dividend history is crucial as it reflects the company's past commitment and ability to distribute profits to shareholders. Consistent increases in dividend payments can suggest a company's confidence in its future earnings potential.
| Year | Dividend per Share (USD) |
|---|---|
| 2025 | 2.03 |
| 2024 | 3.92 |
| 2023 | 3.47 |
| 2022 | 3.16 |
| 2021 | 3.03 |
📈 Dividend Growth
Assessing the growth of dividends is imperative as it gives insight into the company's earnings growth and dividend policy strategy. Sustainable dividend growth vs payout rates helps gauge overall dividend sustainability.
| Time | Growth |
|---|---|
| 3 years | 8.96% |
| 5 years | 5.57% |
The average dividend growth is 5.57% over 5 years. This shows moderate but steady dividend growth.
📉 Payout Ratio
The payout ratio is a crucial metric indicating the proportion of earnings a firm pays to its shareholders in dividends. A high payout ratio can indicate a lack of reinvestment opportunities but may be risky if earnings fluctuate.
| Key Figure | Ratio |
|---|---|
| EPS-based | -891.27% |
| Free Cash Flow-based | 36.81% |
The negative EPS payout ratio is alarming and suggests distributions may exceed earnings, relying heavily on cash flow or external financing. The FCF-based ratio is more conservative, indicating prudency in cash flow allocations.
💰 Cashflow & Capital Efficiency
Evaluating cash flow and capital efficiency is vital. High capital effectiveness often correlates with the potential for sustained dividend payments and growth.
| Metric | 2025 | 2024 | 2023 |
|---|---|---|---|
| Free Cash Flow Yield | 6.09% | 3.32% | 4.00% |
| Earnings Yield | -0.26% | 3.79% | -0.09% |
| CAPEX to Operating Cash Flow | 38.52% | 45.65% | 37.56% |
| Stock-based Compensation to Revenue | 0.71% | 0.64% | 0.72% |
| Free Cash Flow / Operating Cash Flow Ratio | 61.48% | 54.35% | 62.44% |
The overall cash flow stability appears sound, with efficiency metrics suggesting a conducive environment for sustained profitability and operational expansion.
💹 Balance Sheet & Leverage Analysis
A holistic view of the balance sheet and leverage metrics is indispensable in evaluating the company's ability to meet long-term obligations.
| Metric | 2025 | 2024 | 2023 |
|---|---|---|---|
| Debt-to-Equity | 1.76 | 1.29 | 1.48 |
| Debt-to-Assets | 0.56 | 0.49 | 0.51 |
| Debt-to-Capital | 0.64 | 0.56 | 0.60 |
| Net Debt to EBITDA | 15.55 | 4.02 | 9.80 |
| Current Ratio | 0.92 | 1.19 | 1.18 |
| Quick Ratio | 0.56 | 0.53 | 0.54 |
| Financial Leverage | 3.15 | 2.64 | 2.93 |
While leverage ratios appear elevated, the company's strategic debt management and liquidity ratios indicate resilience against economic fluctuations.
💪 Fundamental Strength & Profitability
Thorough analysis of profitability metrics and fundamental indicators can gauge the company's efficiency and effectiveness in generating shareholder returns.
| Metric | 2025 | 2024 | 2023 |
|---|---|---|---|
| Return on Equity | -1.18% | 17.73% | -0.46% |
| Return on Assets | -0.38% | 6.72% | -0.16% |
| Net Margin | -0.80% | 17.34% | -0.41% |
| EBIT Margin | 3.22% | 26.67% | 8.27% |
| EBITDA Margin | 7.58% | 30.97% | 13.31% |
| Gross Margin | 52.06% | 50.37% | 50.45% |
| R&D to Revenue | 0.00% | 0.00% | 0.00% |
Despite some negative profitability metrics, the gross margins remain robust, suggesting potential for recovery and strategic redirection towards profitable operations.
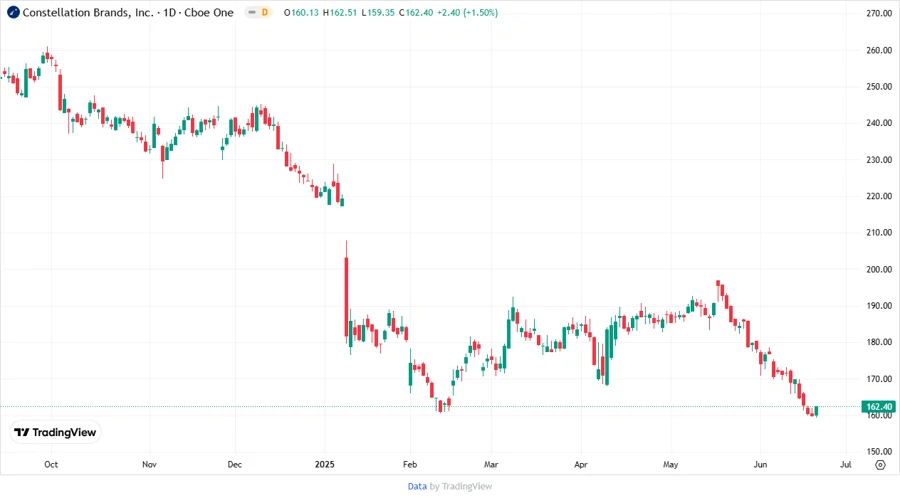
📈 Price Development
✅ Dividend Scoring System
| Criteria | Score | Representation |
|---|---|---|
| Dividend yield | 3 | |
| Dividend Stability | 4 | |
| Dividend growth | 3 | |
| Payout ratio | 2 | |
| Financial stability | 2 | |
| Dividend continuity | 4 | |
| Cashflow Coverage | 3 | |
| Balance Sheet Quality | 2 |
Total Score: 23 / 40
🌟 Rating
In summary, Constellation Brands, Inc. presents a mixed dividend profile. The company's history of dividend increases is commendable, but investors should beware of its high EPS payout ratio and leverage metrics. The dividend could see steady growth with improvements in financial stability and strategic redirection.
Smart Data Insight
Master the Perfect Entry & Exit for this Stock
Don't leave your profits to chance. Historically, this stock follows specific seasonal patterns that institutional traders use to maximize returns.
- ✅ Identify the "Golden Buying Window"
- ✅ Avoid high-risk correction cycles
- ✅ Backtested data from the last 20+ years