May 13, 2026 a 01:15 pm

STX: Trend and Support & Resistance Analysis - Seagate Technology Holdings plc
Seagate Technology Holdings plc has shown substantial volatility over the past months. The company's share prices have moved in both significant upward and downward directions, reflecting broader market conditions and company-specific news. Current data suggests a dynamic trading environment, but with signs of recovery. Investors should remain vigilant and consider both technical indicators and fundamental factors when evaluating this stock.
Trend Analysis
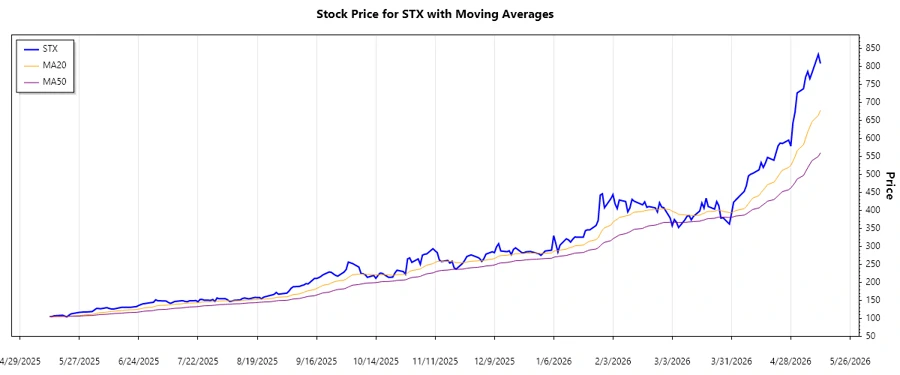
The analysis of Seagate's stock price data reveals a dynamic pattern over the examined period. A clear upward trend is distinguished where the EMA20 surpasses the EMA50, indicating buyer dominance and potential continued bullish sentiment. The table below highlights the last seven trading days' data:
| Date | Close Price ($) | Trend |
|---|---|---|
| 2026-05-12 | 808.8 | ▲ Upward |
| 2026-05-11 | 834.01 | ▲ Upward |
| 2026-05-08 | 782.64 | ▲ Upward |
| 2026-05-07 | 766.44 | ▲ Upward |
| 2026-05-06 | 786.42 | ▲ Upward |
| 2026-05-05 | 771.01 | ▲ Upward |
| 2026-05-04 | 738.54 | ⚖️ Sideways |
Technically, the crossover of shorter-term EMA over the longer-term EMA signifies a bullish market sentiment, indicating potential for further gains if support levels hold.
Support and Resistance
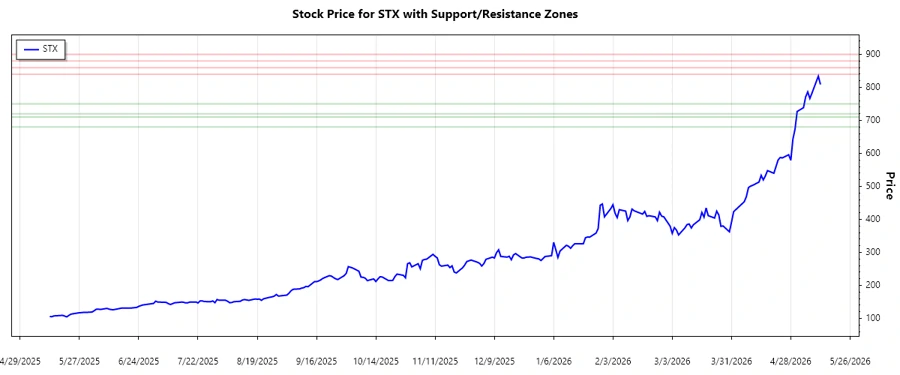
The analysis of support and resistance levels indicates key zones which are critical for traders. Identified support zones suggest areas where buying interest could emerge, while resistance zones reflect potential selling pressure:
| Zone | From ($) | To ($) |
|---|---|---|
| Support Zone 1 | 720.00 | 750.00 |
| Support Zone 2 | 680.00 | 710.00 |
| Resistance Zone 1 | 840.00 | 860.00 |
| Resistance Zone 2 | 880.00 | 900.00 |
Currently, the stock price is within proximity to the first resistance zone, implying the possibility of either a breakout or reversal.
Conclusion
Seagate Technology's stock is on the move with upward momentum, driven by strong technical indicators. The price near critical resistance zones implies a significant testing point for the stock, where a breakout could suggest further upside. However, if the resistance holds, a pullback to support areas could occur. For potential investors, it's crucial to weigh these movements with fiscal fundamentals. In summary, opportunities exist for profitable trading, but vigilance regarding market changes is essential.
Smart Data Insight
Master the Perfect Entry & Exit for this Stock
Don't leave your profits to chance. Historically, this stock follows specific seasonal patterns that institutional traders use to maximize returns.
- ✅ Identify the "Golden Buying Window"
- ✅ Avoid high-risk correction cycles
- ✅ Backtested data from the last 20+ years