April 14, 2026 a 08:15 am


STX: Trend and Support & Resistance Analysis - Seagate Technology Holdings plc
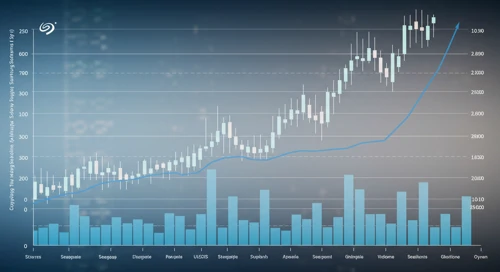
Seagate Technology Holdings plc has shown significant fluctuation in its stock price over recent months. With a core focus on data storage solutions globally, the company faces both opportunities and challenges. Recent market movements have depicted noticeable trends in the stock's performance, characterized by potential for gain and risk exposure, necessitating thorough technical analysis for accurate forecasting.
Trend Analysis
| Date | Closing Price | Trend |
|---|---|---|
| 2026-04-13 | 513.28 | ▲ Uptrend |
| 2026-04-10 | 503.13 | ▲ Uptrend |
| 2026-04-09 | 500.77 | ▲ Uptrend |
| 2026-04-08 | 496.30 | ▲ Uptrend |
| 2026-04-07 | 468.72 | ▲ Uptrend |
| 2026-04-06 | 453.30 | ▲ Uptrend |
| 2026-04-02 | 429.36 | ▲ Uptrend |
The calculation of the EMA20 and EMA50 indicators positions the stock firmly within an upward trend, providing potential bullish signals for traders.
Support- and Resistance
| Zone Type | Range |
|---|---|
| Resistance 1 | ▲ 513 - 523 |
| Resistance 2 | ▲ 503 - 512 |
| Support 1 | ▼ 473 - 483 |
| Support 2 | ▼ 453 - 462 |
The current stock price finds itself near a resistance zone, suggesting possible price consolidation or reversal might occur. Investors and traders should monitor the stock's performance for breaks or confirmations of these levels.
Conclusion
The STX stock showcases a promising upward trajectory, yet proximity to resistance zones demands cautious optimism. While the upward trend signals potential bullish momentum driven by returning investor confidence or positive market conditions, resistance levels necessitate mindfulness of potential pullbacks. Investors should remain vigilant for entries and exits based on support and resistance confirmations, considering broader market trends. Moreover, potential external factors influencing the data storage sector should also be contemplated when assessing medium to long-term prospects.