
July 08, 2026 a 11:31 am
STX: Dividend Analysis - Seagate Technology Holdings plc
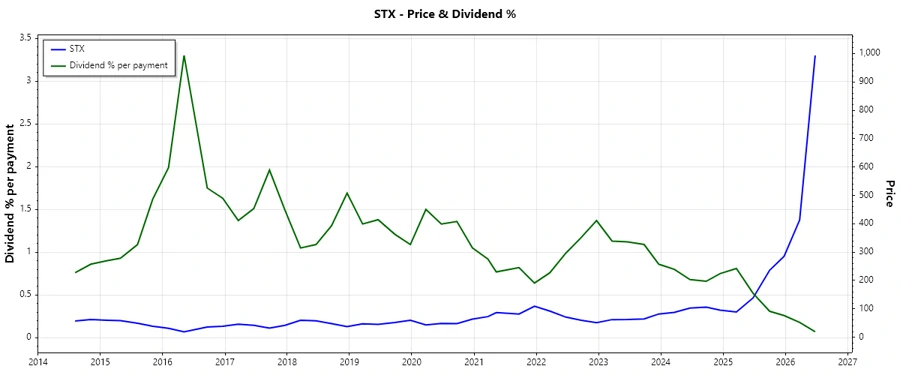
📊 Seagate Technology Holdings plc presents a robust dividend profile with a long-standing history of payouts. The company boasts a current dividend yield of approximately 29.6%, combined with gradual dividend growth over the past half-decade. With a history of 23 consecutive years of dividends, stability seems to be a firm anchor in its financial strategy. However, close attention should be paid to the financial ratios related to payout and cash flow, impacting future dividend sustainability.
Seagate Technology Holdings plc offers an intriguing dividend profile marked by consistent growth and notable yield percentages. Despite a rich dividend history, the company faces challenges in maintaining optimal payout and financial stability. Investors should weigh the company's growth trajectory against potential risks.
Overview
| Metrics | Details |
|---|---|
| Sector | Technology |
| Dividend yield | 29.6 % |
| Current dividend per share | 2.83 USD |
| Dividend history | 23 years |
| Last cut or suspension | None |
Dividend History
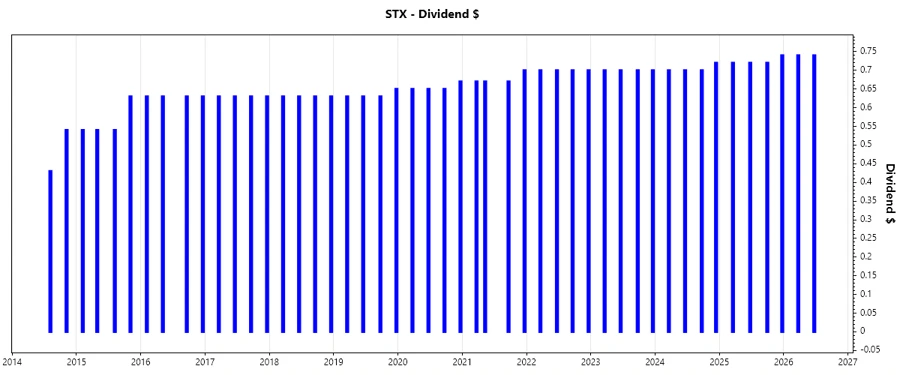
🗣️ Understanding the dividend history helps in evaluating the predictability and reliability of future payouts. Seagate's consistent dividend payouts are indicative of its financial health and commitment to returning value to shareholders. Investors often seek past dividend stability as an assurance for future income streams.
| Year | Dividend per Share |
|---|---|
| 2026 | 1.48 USD |
| 2025 | 2.90 USD |
| 2024 | 2.82 USD |
| 2023 | 2.80 USD |
| 2022 | 2.80 USD |
Dividend Growth
📈 The rate of dividend growth offers insight into a company's commitment to increasing shareholder returns, which is a key attraction for income investors. Seagate exhibits modest dividend growth over 3 and 5-year spans, reflective of stable financial management amidst market variability.
| Time | Growth |
|---|---|
| 3 years | 1.18 % |
| 5 years | 2.05 % |
The average dividend growth is 2.05% over 5 years. This shows moderate but steady dividend growth.
Payout Ratio
📉 A company's payout ratio signifies how much of its earnings are distributed as dividends. Key figures for Seagate demonstrate conservative management, with EPS-based payout at 26.3% and FCF-based at 24.1%. These ratios suggest ample room for reinvestment while maintaining healthy dividends.
| Key figure | Ratio |
|---|---|
| EPS-based | 26.3 % |
| Free cash flow-based | 24.1 % |
These figures are indicative of sound financial management, allowing Seagate to sustain and potentially grow its dividend, assuming earnings stability.
Cashflow & Capital Efficiency
✅ Effective cash management and capital efficiency are crucial for sustaining operational stability and shareholder returns. Seagate's mix of free cash flow yield and earnings yield ratios reflect its cash generation capacities, while CAPEX commitments showcase potential growth reinvestments.
| Metric | 2025 | 2024 | 2023 |
|---|---|---|---|
| Free Cash Flow Yield | 2.73 % | 3.08 % | 4.89 % |
| Earnings Yield | 4.90 % | 1.55 % | -4.13 % |
| CAPEX to Operating Cash Flow | 24.47 % | 27.67 % | 33.54 % |
| Stock-based Compensation to Revenue | - | - | - |
| Free Cash Flow / Operating Cash Flow Ratio | - | - | - |
Seagate's strong cash flow metrics suggest robust financial health capable of supporting its dividend policy and potential strategic investments.
Balance Sheet & Leverage Analysis
⚠️ Assessing debt related metrics provides insight into a company's financial robustness. Seagate's debt ratios suggest a well-managed leverage strategy, yet investors should remain vigilant for any shifts that may impact financial stability, particularly in challenging market conditions.
| Metric | 2025 | 2024 | 2023 |
|---|---|---|---|
| Debt-to-Equity | -11.03 | -3.81 | -4.87 |
| Debt-to-Assets | 62.26% | 73.32% | 77.22% |
| Debt-to-Capital | 109.97% | 135.64% | 125.86% |
| Net Debt to EBITDA | 1.97 | 4.15 | 15.30 |
| Current Ratio | 1.38 | 1.08 | 1.12 |
| Quick Ratio | 0.84 | 0.68 | 0.68 |
| Financial Leverage | -17.71 | -5.19 | -6.30 |
The company appears over-leveraged, with high debt-to-equity ratios signifying potential concerns in financial flexibility and risk management.
Fundamental Strength & Profitability
📈 Evaluating core profitability metrics is essential for understanding potential growth and operational efficiency. Seagate's performance across return metrics and margins suggests areas of robust performance, warranting deeper analysis on a line-by-line basis for investment validity.
| Metric | 2025 | 2024 | 2023 |
|---|---|---|---|
| Return on Equity | -3.24% | -0.22% | 0.44% |
| Return on Assets | 18.31% | 4.33% | -7.00% |
| Margins: Net | 16.15% | 5.11% | -7.16% |
| EBIT | 20.16% | 11.86% | -2.48% |
| EBITDA | 22.92% | 15.89% | 4.47% |
| Gross | 35.18% | 23.45% | 19.20% |
| Research & Development to Revenue | 7.96% | 9.98% | 10.79% |
Mixed results in fundamental strength illustrate Seagate's enduring capacity to drive value through strategic spending and thoughtful execution.
Price Development
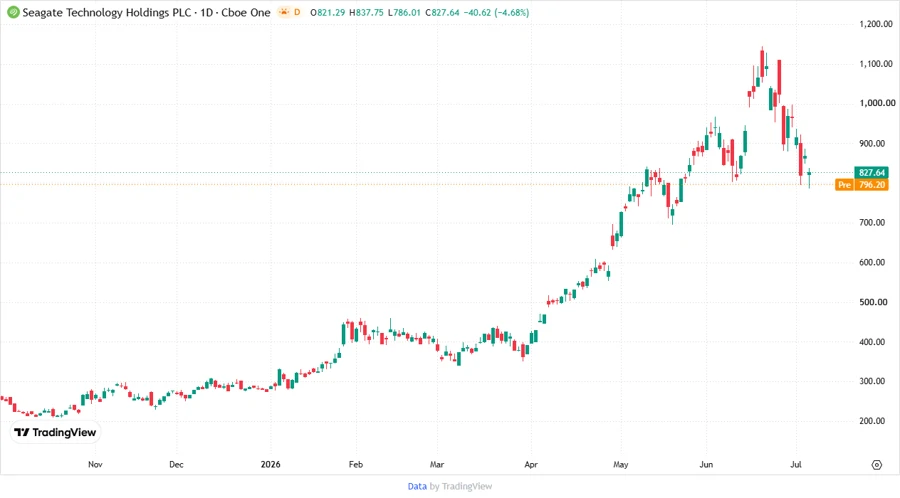
📊 Examining price development equips investors with context regards market perceptions and investment sentiments.
Dividend Scoring System
✅ A composite score evaluating various aspects of Seagate's dividend metrics offers a holistic insight into potential investment value.
| Criteria | Score | Visual |
|---|---|---|
| Dividend yield | 3/5 | |
| Dividend Stability | 4/5 | |
| Dividend growth | 2/5 | |
| Payout ratio | 4/5 | |
| Financial stability | 1/5 | |
| Dividend continuity | 5/5 | |
| Cashflow Coverage | 3/5 | |
| Balance Sheet Quality | 2/5 |
Total Score: 24/40
Rating
🗣️ Seagate Technology Holdings plc scores moderately on dividend sustainability and attractiveness, suggesting it as a potentially favorable option for income-focused portfolios, albeit with a cautious approach in light of financial leverage challenges and evolving industry dynamics. Appropriately balanced portfolios should weigh potential rewards against the inherent risks presented by its financial structure.
Smart Data Insight
Master the Perfect Entry & Exit for this Stock
Don't leave your profits to chance. Historically, this stock follows specific seasonal patterns that institutional traders use to maximize returns.
- ✅ Identify the "Golden Buying Window"
- ✅ Avoid high-risk correction cycles
- ✅ Backtested data from the last 20+ years