May 08, 2026 a 03:31 pm

STX: Dividend Analysis - Seagate Technology Holdings plc
Seagate Technology Holdings plc, a leader in data storage solutions, offers substantial dividends with a 23-year history of consistent payouts. The company's focus on innovation and strong market presence make it a noteworthy option for dividend-focused investors. However, cautious examination of payout ratios and recent financial performances is advised.
Overview
Seagate Technology's dividend profile reveals consistent yield and reliable payouts, enhancing its attractiveness to dividend investors. The company has maintained its dividend history for over two decades, indicating stability and commitment to returning value to shareholders.
| Metric | Details |
|---|---|
| Sector | Technology |
| Dividend yield | 0.37 % |
| Current dividend per share | 2.83 USD |
| Dividend history | 23 years |
| Last cut or suspension | None |
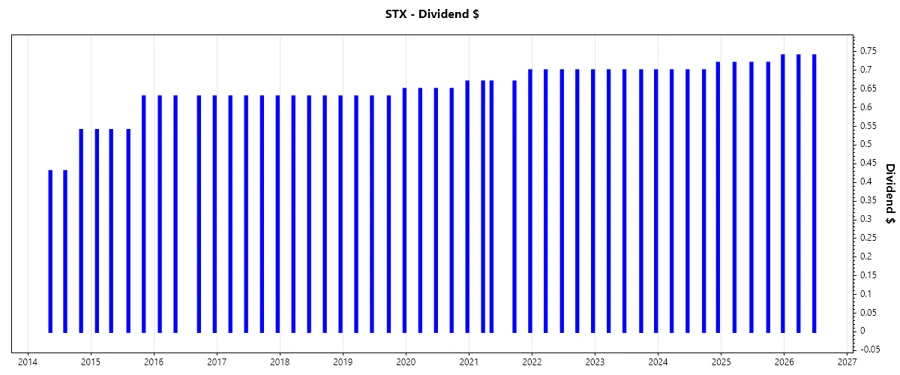
Dividend History
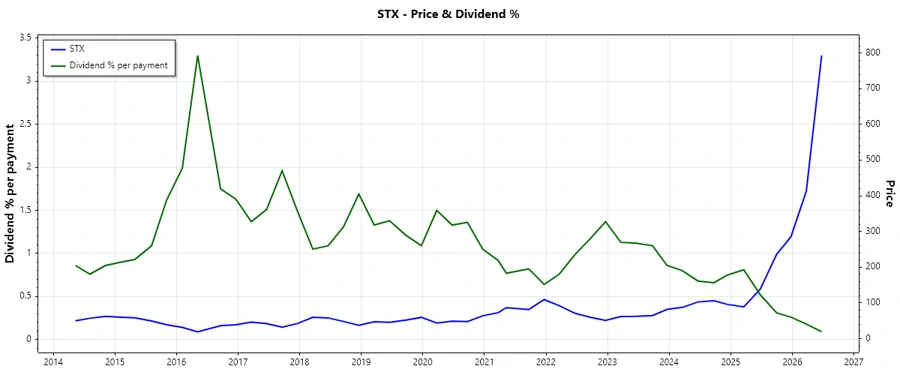
Seagate's enduring dividend history reflects its sustained profitability and commitment to rewarding shareholders. Understanding the payment trends can guide investors in predicting future dividend payouts and ensuring income stability.
| Year | Dividend per Share (USD) |
|---|---|
| 2026 | 1.48 |
| 2025 | 2.90 |
| 2024 | 2.82 |
| 2023 | 2.80 |
| 2022 | 2.80 |
Dividend Growth
Analyzing dividend growth is vital for assessing future income potential. Seagate shows moderate expansion, important for long-term dividend sustainability.
| Time | Growth |
|---|---|
| 3 years | 1.18 % |
| 5 years | 2.05 % |
The average dividend growth is 2.05 % over 5 years. This shows moderate but steady dividend growth.
Payout Ratio
Payout ratios offer insights into how well earnings compensate dividend payouts, essential for financial health assessment. Seagate's EPS and FCF-based payout ratios indicate sound financial management.
| Key figure ratio | Percentage |
|---|---|
| EPS-based | 26.30 % |
| Free cash flow-based | 24.10 % |
With a 26.30 % payout based on EPS and 24.10 % on FCF, Seagate shows a conservative approach that supports dividend sustainability.
Cashflow & Capital Efficiency
An efficient use of cash flow enhances Seagate's ability to support ongoing dividend payments and capitalize on growth opportunities.
| Year | 2025 | 2024 | 2023 |
|---|---|---|---|
| Free Cash Flow Yield | 2.73 % | 3.08 % | 4.89 % |
| Earnings Yield | 4.90 % | 1.55 % | -4.13 % |
| CAPEX to Operating Cash Flow | 24.47 % | 27.67 % | 33.55 % |
| Stock-based Compensation to Revenue | 2.20 % | 1.94 % | 1.56 % |
| Free Cash Flow / Operating Cash Flow Ratio | 75.53 % | 72.33 % | 66.45 % |
Seagate demonstrates robust cash flow management, contributing to sustained dividend coverage and capital reinvestment prospects.
Balance Sheet & Leverage Analysis
Understanding the leverage ratios and financial structure assists in evaluating the company's risk profile and financial stability.
| Year | 2025 | 2024 | 2023 |
|---|---|---|---|
| Debt-to-Equity | -1186.09 % | -380.55 % | -486.66 % |
| Debt-to-Assets | 66.97 % | 73.32 % | 77.22 % |
| Debt-to-Capital | 109.21 % | 135.64 % | 125.86 % |
| Net Debt to EBITDA | 2.15 | 4.15 | 15.30 |
| Current Ratio | 1.38 | 1.08 | 1.12 |
| Quick Ratio | 0.84 | 0.68 | 0.68 |
| Financial Leverage | -1771.08 % | -519.05 % | -630.19 % |
Seagate's high debt-to-equity ratio suggests significant leverage, which may introduce volatility but could amplify returns if managed prudently.
Fundamental Strength & Profitability
Staple financial ratios illuminate Seagate's efficiency in deploying resources towards generating profits, critical for long-term sustainability.
| Year | 2025 | 2024 | 2023 |
|---|---|---|---|
| Return on Equity | -3.24 % | -0.22 % | 0.44 % |
| Return on Assets | 18.31 % | 4.33 % | -7.00 % |
| Margins: Net | 16.15 % | 5.11 % | -7.16 % |
| EBIT Margin | 20.16 % | 11.86 % | -2.48 % |
| EBITDA Margin | 22.92 % | 15.89 % | 4.47 % |
| Gross Margin | 35.18 % | 23.45 % | 19.20 % |
| R&D to Revenue | 7.96 % | 9.98 % | 10.79 % |
Despite challenges, Seagate's profitability metrics indicate potential for operational improvements and competitive advantage sustainment.
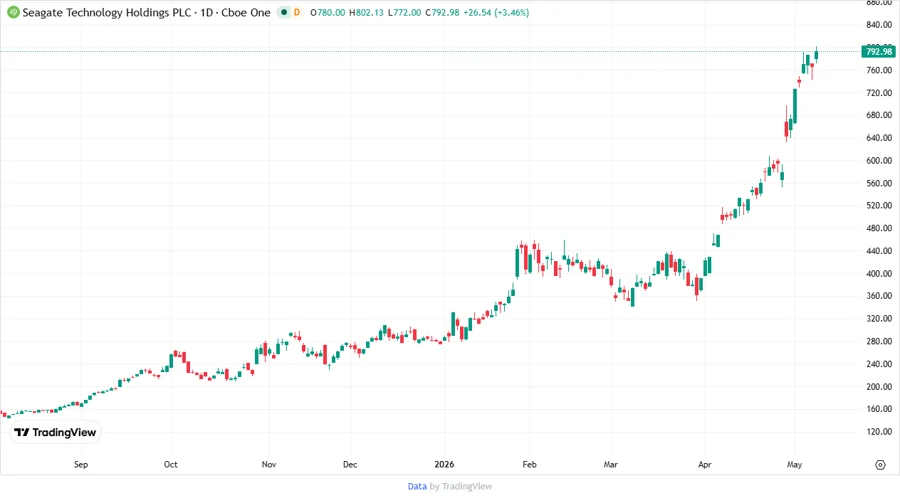
Price Development
A visual showing price trends aids investors in discerning patterns and the potential direction of the stock.
Dividend Scoring System
| Category | Score | Bar |
|---|---|---|
| Dividend yield | 3 | |
| Dividend Stability | 4 | |
| Dividend growth | 2 | |
| Payout ratio | 4 | |
| Financial stability | 2 | |
| Dividend continuity | 5 | |
| Cashflow Coverage | 3 | |
| Balance Sheet Quality | 2 |
Overall Score: 25/40
Rating
Seagate Technology Holdings plc demonstrates a solid dividend history and commitment to shareholder returns despite some financial leverage concerns. It's suitable for investors valuing consistent income, but a thorough risk assessment related to financial leverage is crucial.
Smart Data Insight
Master the Perfect Entry & Exit for this Stock
Don't leave your profits to chance. Historically, this stock follows specific seasonal patterns that institutional traders use to maximize returns.
- ✅ Identify the "Golden Buying Window"
- ✅ Avoid high-risk correction cycles
- ✅ Backtested data from the last 20+ years