October 16, 2025 a 03:31 am


STX: Dividend Analysis - Seagate Technology Holdings plc
Seagate Technology Holdings plc provides a promising dividend profile with a long history of consistent payouts. Despite some fluctuations in recent performance metrics, the company's commitment to returning value to shareholders remains evident. Investors should keep an eye on payout sustainability and financial health metrics to assess the impact on future dividend decisions.
📊 Overview
The evaluation of Seagate's dividend profile includes their consistent sector presence and yield metrics. With over two decades of maintained dividend history, the firm's recent yield stands at a modest 1.22%.
| Metric | Value |
|---|---|
| Sector | Technology |
| Dividend yield | 1.22 % |
| Current dividend per share | 2.83 USD |
| Dividend history | 22 years |
| Last cut or suspension | None |
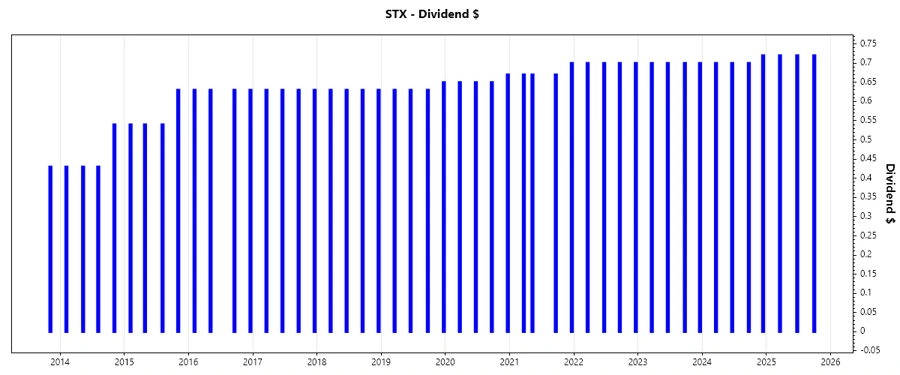
📈 Dividend History
Seagate has a solid 22-year history of dividend payouts, evidencing strong shareholder commitment. Historical payments are instrumental in forecasting future distributions and assessing resilience against market volatilities.
| Year | Dividend per Share (USD) |
|---|---|
| 2025 | 2.16 |
| 2024 | 2.82 |
| 2023 | 2.80 |
| 2022 | 2.80 |
| 2021 | 2.71 |
📈 Dividend Growth
The growth trend accentuates Seagate's commitment to enhancing shareholder returns, albeit at a modest pace over the last 3 to 5 years. Understanding growth dynamics is key for ensuring the dividends keep pace with inflation and sector growth.
| Time | Growth |
|---|---|
| 3 years | 1.34 % |
| 5 years | 2.11 % |
The average dividend growth is 2.11% over 5 years. This shows moderate but steady dividend growth.
📊 Payout Ratio
Understanding payout ratios helps assess whether dividends are sustainable. Seagate's payout uses an EPS-based approach (40.84%) and a more concerning free cash flow (FCF) payout (73.59%), indicating cash flow sustainability needs attention.
| Key figure ratio | Percentage |
|---|---|
| EPS-based | 40.84 % |
| Free cash flow-based | 73.59 % |
While the EPS payout is within conservative bounds, the FCF payout ratio signals potential liquidity strains should earnings or cash flow weaken.
💹 Cashflow & Capital Efficiency
This analysis focuses on cash management and efficiency, critical for sustaining long-term dividend growth while managing debt and capital expenditures efficiently.
| Year | 2025 | 2024 | 2023 |
|---|---|---|---|
| Free Cash Flow Yield | 2.73 % | 3.08 % | 4.89 % |
| Earnings Yield | 4.89 % | 1.55 % | -4.13 % |
| CAPEX to Operating Cash Flow | 24.47 % | 27.67 % | 33.55 % |
| Stock-based Compensation to Revenue | 2.20 % | 1.94 % | 1.56 % |
| Free Cash Flow / Operating Cash Flow Ratio | 75.53 % | 72.33 % | 66.45 % |
The analysis reveals a constraining CAPEX to cash flow relationship, demanding efficient capital management to maintain robust returns on invested capital for sustained dividend growth.
💳 Balance Sheet & Leverage Analysis
Evaluating leverage and liquidity metrics provides insight into Seagate's financial health. Strong liquidity ratios suggest better short-term financial handle, crucial for dividend maintenance.
| Year | 2025 | 2024 | 2023 |
|---|---|---|---|
| Debt-to-Equity | -1102.65 % | -380.55 % | -486.66 % |
| Debt-to-Assets | 62.26 % | 73.32 % | 77.22 % |
| Debt-to-Capital | 109.97 % | 135.64 % | 125.86 % |
| Net Debt to EBITDA | 1.97x | 4.15x | 15.30x |
| Current Ratio | 1.38x | 1.08x | 1.12x |
| Quick Ratio | 0.84x | 0.68x | 0.68x |
| Financial Leverage | -1771.08 % | -519.05 % | -630.19 % |
Despite strong liquidity metrics, high leverage ratios pose potential risk to financial stability, warranting prudent management to assure confidence in ongoing dividend provision.
💹 Fundamental Strength & Profitability
Profitability ratios serve as indicators of internal efficiency and competence in using assets and equity to generate returns, pivotal for sustaining dividend payouts.
| Year | 2025 | 2024 | 2023 |
|---|---|---|---|
| Return on Equity | -3.24 % | -0.22 % | 0.44 % |
| Return on Assets | 18.31 % | 4.33 % | -7.00 % |
| Margins: Net | 0.16 % | 0.05 % | -0.07 % |
| Margins: EBIT | 20.16 % | 11.86 % | -2.48 % |
| Margins: EBITDA | 22.92 % | 15.89 % | 4.47 % |
| Margins: Gross | 35.18 % | 23.45 % | 19.20 % |
| Research & Development to Revenue | 7.96 % | 9.98 % | 10.79 % |
There exists variability in profitability metrics which indicate potential issues in maximizing returns from investments and assets, presenting potential headwinds to dividend growth.
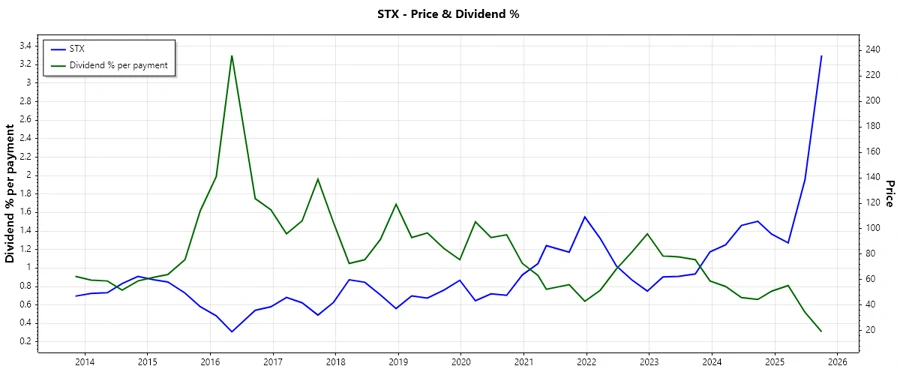
📈 Price Development
🔍 Dividend Scoring System
| Category | Score | |
|---|---|---|
| Dividend yield | 3 | |
| Dividend stability | 4 | |
| Dividend growth | 3 | |
| Payout ratio | 3 | |
| Financial stability | 2 | |
| Dividend continuity | 5 | |
| Cashflow coverage | 2 | |
| Balance sheet quality | 2 |
Overall Score: 24/40 points
🗣️ Rating
In sum, Seagate Technology Holdings plc presents a compelling yet cautiously nuanced dividend profile. While historical commitment and moderate growth reflect positively, investors must remain vigilant of leverage ratios and cash coverage constraints, balancing these against the potential risks and rewards. Suitable for income-seeking investors aligning with moderate growth trajectories.