May 21, 2026 a 04:44 pm
STT: Fibonacci Analysis - State Street Corporation
State Street Corporation, a financial services giant, exhibits a resilient operation within institutional investment services. The historical data indicates a dominant upward trend with a significant price surge during the last few months. The company's stable operations and comprehensive service offerings position it well for sustainable growth. However, investors should remain vigilant about market fluctuations and their potential impact. This analysis shall dive into the technicals using Fibonacci retracement to better understand support and resistance levels.
Fibonacci Analysis
| Analysis Metric | Details |
|---|---|
| Trend Period | 2025-12-01 to 2026-05-21 |
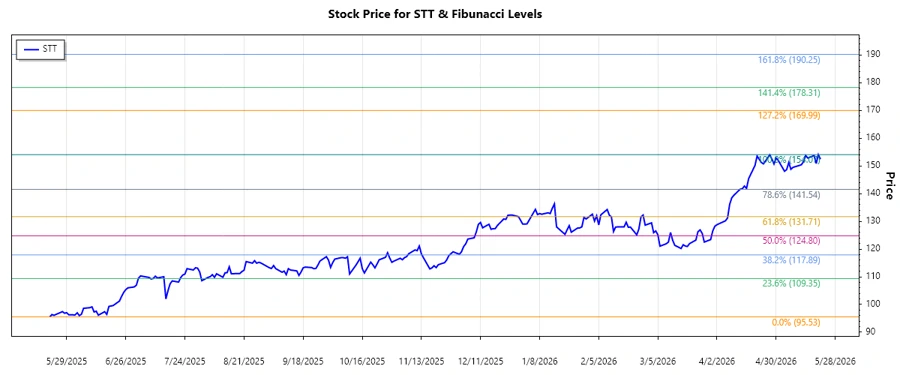
| High Point (Price & Date) | $154.07 on 2026-05-20 |
| Low Point (Price & Date) | $95.53 on 2025-05-21 |
| Fibonacci Levels |
|
| Retracement Zone | 0.786 |
| Technical Interpretation | The current price sits within the 78.6% retracement level, hinting at a potential resistance ahead. Investors may need to watch for a possible pullback before any further upside can be convincingly resumed. |
Conclusion
The trend for State Street Corporation showcases a robust upward movement, signaling an encouraging outlook for future stock performance. The analysis suggests that while an upward trajectory is evident, the proximity to the 78.6% resistance level might anticipate a consolidation phase. Risks stem from broader market conditions and economic changes that could influence investor confidence. Nonetheless, the positive trend continues to present opportunities for gains, contingent on strategic entry points and ongoing price movement verification. Analysts should remain attentive to incoming data and company announcements that might impact this retracement zone and influence market sentiment.
Smart Data Insight
Master the Perfect Entry & Exit for this Stock
Don't leave your profits to chance. Historically, this stock follows specific seasonal patterns that institutional traders use to maximize returns.
- ✅ Identify the "Golden Buying Window"
- ✅ Avoid high-risk correction cycles
- ✅ Backtested data from the last 20+ years