October 10, 2025 a 03:15 pm
STT: Fibonacci Analysis - State Street Corporation
The State Street Corporation has recently shown considerable resilience in the market amidst fluctuations in the financial sector. With a positive outlook driven by solid fundamentals and strategic initiatives, STT stands well-positioned for potential upward momentum. The stock's performance has demonstrated a robust recovery pattern, suggesting further opportunities for investors.
Fibonacci Analysis
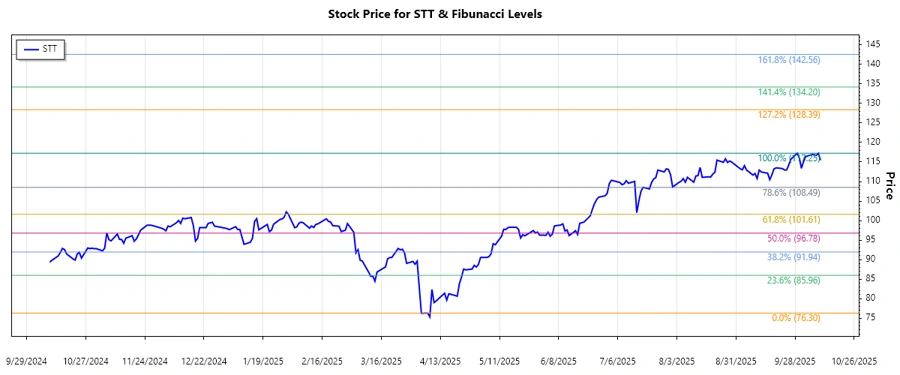
The Fibonacci analysis was conducted based on recent data for the State Street Corporation (STT). A clear upward trend was identified, observing a significant increase over several months.
| Detail | Information |
|---|---|
| Trend Start Date | 2025-04-07 |
| Trend End Date | 2025-10-09 |
| High Price | $117.25 on 2025-09-29 |
| Low Price | $76.3 on 2025-04-07 |
Fibonacci Levels
| Level | Price |
|---|---|
| 0.236 | $92.82 |
| 0.382 | $100.22 |
| 0.5 | $101.78 |
| 0.618 | $103.34 |
| 0.786 | $109.34 |
Currently, the price resides in the 0.618 retracement zone, indicating a potential support area that may lead to a continuation of the upward trend. This suggests a strong possibility for further gains if the support holds.
Conclusion
State Street Corporation's recent performance illustrates a robust uptrend indicative of the company's resilience and sound financial footing. The stock's positioning within key Fibonacci retracement levels could herald additional upward momentum, offering ample opportunity for growth. However, as always, market volatility and external economic factors should continue to be considered. For analysts and investors, these findings underscore the importance of closely monitoring support and resistance levels, allowing for strategic decision-making based on technical analyses.
Smart Data Insight
Master the Perfect Entry & Exit for this Stock
Don't leave your profits to chance. Historically, this stock follows specific seasonal patterns that institutional traders use to maximize returns.
- ✅ Identify the "Golden Buying Window"
- ✅ Avoid high-risk correction cycles
- ✅ Backtested data from the last 20+ years