
July 25, 2026 a 03:31 am

STT: Dividend Analysis - State Street Corporation
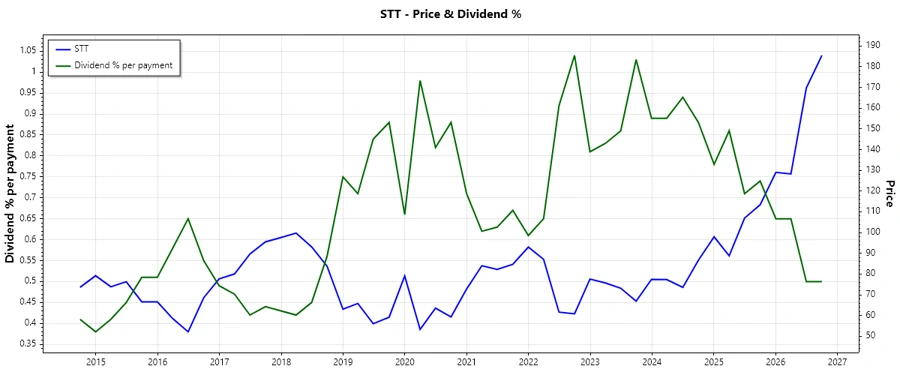
State Street Corporation has demonstrated a robust history of dividend payments with a current dividend yield of 1.86%. Despite a recent cut or suspension in 2024, the company shows a strong foundational strategy with consistent dividend payments for over 43 years. Future growth indicators suggest a moderate but sustainable increase in dividends, promising potential for yield-focused investors.
📊 Overview
The financial sector's resilience is notably underscored by State Street Corporation's consistent dividend yield and historical performance. As of now, it delivers a modest 1.86% yield with each share promising $3.94 annually. This consistent payout over 43 years highlights stability, albeit with a recent disruption in 2024.
| Sector | Dividend Yield | Current DPS | Dividend History | Last Cut/Suspension |
|---|---|---|---|---|
| Financial | 1.86% | $3.94 | 43 years | 2024 |
🗣️ Dividend History
Reviewing the dividend history, the precedent of consistent payouts is evident. This reliable trend is crucial for long-term income planning.
| Year | Dividend Per Share (USD) |
|---|---|
| 2026 | 3.44 |
| 2025 | 3.12 |
| 2024 | 2.14 |
| 2023 | 2.64 |
| 2022 | 2.40 |
📈 Dividend Growth
Historically, STT's dividends have shown calculated growth. This growth is vital for offsetting inflation and increasing shareholder returns.
| Time | Growth |
|---|---|
| 3 years | 9.14% |
| 5 years | 8.45% |
The average dividend growth is 8.45% over 5 years. This shows moderate but steady dividend growth.
✅ Payout Ratio
Payout ratios help gauge the sustainability of a company's dividend. Here EPS-based coverage sits comfortably at 31.71%, whereas FCF-based payout raises concerns due to negative coverage.
| Key figure ratio | Percentage |
|---|---|
| EPS-based | 31.71% |
| Free cash flow-based | -9.19% |
The EPS payout ratio of 31.71% suggests healthy dividend coverage, although the negative FCF ratio indicates potential liquidity issues.
🧾 Cashflow & Capital Efficiency
Examining cash flow and capital efficiency provides insight into the financial health and operational gearing of STT. These metrics assess extraction of value from assets.
| Metric | 2025 | 2024 | 2023 |
|---|---|---|---|
| Free Cash Flow Yield | 11.69% | -48.35% | -0.50% |
| Earnings Yield | 8.02% | 9.19% | 7.79% |
| CAPEX to Operating Cash Flow | 19.73% | -7.01% | 118.26% |
| Stock-based Compensation to Revenue | 1.26% | 0% | 0% |
| Free Cash Flow / Operating Cash Flow Ratio | 80.27% | 107.01% | -18.26% |
Cash flow stability shows mixed results, indicating areas needing attention. High CAPEX relative to operating cash indicates a potential strain on liquidity.
📉 Balance Sheet & Leverage Analysis
Strong balance sheets and judicious leverage management are essential for financial stability. These indicators affect the firm’s ability to sustain operations through cash flow variability.
| Metric | 2025 | 2024 | 2023 |
|---|---|---|---|
| Debt-to-Equity | 107.05% | 145.28% | 102.38% |
| Debt-to-Assets | 8.14% | 10.42% | 8.20% |
| Debt-to-Capital | 51.70% | 59.23% | 50.59% |
| Net Debt to EBITDA | -23.70 | -19.83 | -21.06 |
| Current Ratio | 0.68 | 0.51 | 0.63 |
| Quick Ratio | 0.68 | 0.51 | 0.63 |
| Financial Leverage | 13.15 | 13.95 | 12.49 |
The balance sheet suggests moderate leverage, although the debt-to-equity ratio above industry average should be mitigated to safeguard long-term financial flexibility.
🏦 Fundamental Strength & Profitability
Profitability indicators reflect business efficiency and management's effectiveness in deploying assets to generate returns. These metrics help identify strengths and vulnerabilities in current operations.
| Metric | 2025 | 2024 | 2023 |
|---|---|---|---|
| Return on Equity | 10.58% | 10.61% | 8.17% |
| Return on Assets | 0.80% | 0.76% | 0.65% |
| Net Margin | 13.01% | 12.23% | 10.58% |
| EBIT Margin | 16.49% | 15.45% | 12.61% |
| EBITDA Margin | 18.94% | 18.20% | 17.41% |
| Gross Margin | 61.36% | 58.45% | 64.79% |
| R&D to Revenue | 0% | 0% | 0% |
State Street shows strong profitability indicators, with margins reflecting efficient production and operational strategies.
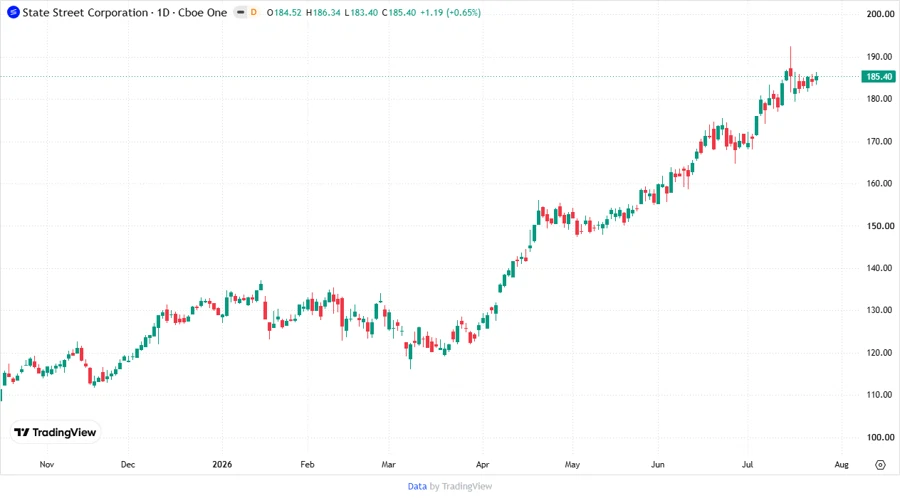
📈 Price Development
🏆 Dividend Scoring System
| Category | Score | Score Bar |
|---|---|---|
| Dividend yield | 3 | |
| Dividend Stability | 4 | |
| Dividend growth | 3 | |
| Payout ratio | 4 | |
| Financial stability | 2 | |
| Dividend continuity | 4 | |
| Cashflow Coverage | 2 | |
| Balance Sheet Quality | 3 |
Total Score: 25 / 40
Ratings
State Street Corporation presents a mixed but promising dividend profile. Though faced with some recent challenges in financial stability, its historical resilience and potential for dividend growth make it a consideration for long-term investors seeking stable returns. However, careful monitoring of debt levels and cash flow stability is advised.
Smart Data Insight
Master the Perfect Entry & Exit for this Stock
Don't leave your profits to chance. Historically, this stock follows specific seasonal patterns that institutional traders use to maximize returns.
- ✅ Identify the "Golden Buying Window"
- ✅ Avoid high-risk correction cycles
- ✅ Backtested data from the last 20+ years