
June 09, 2026 a 11:31 am

STT: Dividend Analysis - State Street Corporation
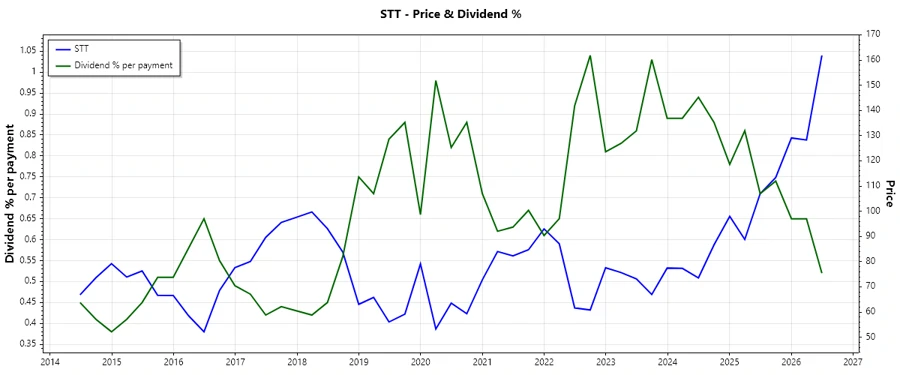
State Street Corporation presents a noteworthy dividend profile characterized by a stable history and moderate growth. With a robust dividend yield at 2.08% and a history of over 43 consecutive years of dividend distribution, the company's commitment to shareholder returns stands out. Despite current economic uncertainties, STT remains a strong candidate for investors seeking consistent dividend returns.
📊 Overview
The following table provides an overview of key dividend statistics for State Street Corporation. The company's sector affiliation, dividend yield, and historical performance indicate its longstanding commitment to shareholder returns.
| Metric | Value |
|---|---|
| Sector | Financials |
| Dividend Yield | 2.08% |
| Current Dividend per Share | 3.94 USD |
| Dividend History | 43 years |
| Last Cut or Suspension | None |
🗣️ Dividend History
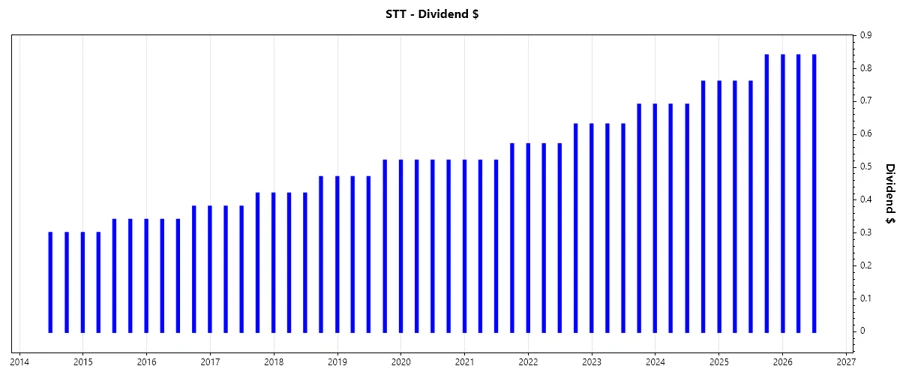
State Street Corporation's dividend history demonstrates a consistent return to investors, reflecting its financial stability and commitment to enhancing shareholder value. Understanding its historical dividend can help predict future dividend sustainability and growth potential.
| Year | Dividend per Share (USD) |
|---|---|
| 2026 | 2.52 |
| 2025 | 3.12 |
| 2024 | 2.14 |
| 2023 | 2.64 |
| 2022 | 2.40 |
📈 Dividend Growth
Evaluating the dividend growth is critical to assessing a company's commitment to increasing shareholder wealth. State Street Corporation's dividends have grown by 9.14% over the last three years and 8.45% over the last five years, indicating moderate but consistent growth in shareholder returns.
| Time | Growth |
|---|---|
| 3 years | 9.14% |
| 5 years | 8.45% |
The average dividend growth is 8.45% over 5 years. This shows moderate but steady dividend growth.
✅ Payout Ratio
The payout ratio is essential for evaluating dividend sustainability. A low payout ratio indicates more room for future dividend increases, whereas a high ratio may be unsustainable. STT's EPS-based payout ratio at 35.76% and FCF-based payout ratio at -9.19% suggest cautious management of payouts, with the negative FCF ratio indicating recent financial strain.
| Key figure | Ratio |
|---|---|
| EPS-based | 35.76% |
| FCF-based | -9.19% |
The EPS payout ratio is conservative, reducing risk of cuts, though negative FCF payout needs attention for cash flow stability.
🌊 Cashflow & Capital Efficiency
Analyzing cash flows and capital efficiency provides insights into a company's operational effectiveness and capital usage. Key ratios include Free Cash Flow Yield and CAPEX to Operating Cash Flow, indicative of how well the company converts sales into cash and manages capital expenditures.
| Metric | 2023 | 2024 | 2025 |
|---|---|---|---|
| Free Cash Flow Yield | -0.50% | -48.35% | 11.69% |
| Earnings Yield | 7.79% | 9.19% | 8.02% |
| CAPEX to Operating Cash Flow | 118.26% | -7.01% | 19.73% |
| Stock-based Compensation to Revenue | 1.26% | ||
| Free Cash Flow / Operating Cash Flow Ratio | -18.26% | 107.01% | 80.27% |
The data reflects a struggling but recovering cash flow situation, with improvements needed to ensure long-term capital efficiency and stability.
🚀 Balance Sheet & Leverage Analysis
The leverage metrics offer a view into a company's funding strategy and risk profile. High leverage can indicate risk, while a conservative balance supports long-term stability.
| Metric | 2023 | 2024 | 2025 |
|---|---|---|---|
| Debt-to-Equity | 1.02 | 1.45 | 1.07 |
| Debt-to-Assets | 8.20% | 10.42% | 8.14% |
| Debt-to-Capital | 50.59% | 59.23% | 51.70% |
| Net Debt to EBITDA | -21.06 | -19.83 | -23.70 |
| Current Ratio | 0.63 | 0.51 | 0.68 |
| Quick Ratio | 0.63 | 0.51 | 0.68 |
| Financial Leverage | 12.49 | 13.95 | 13.15 |
Moderate financial leverage and debt ratios highlight an adherence to a conservative financial policy, maintaining liquidity and stability.
🔍 Fundamental Strength & Profitability
Fundamental analysis allows assessing business efficiency and profitability. Key metrics such as Return on Equity and various margins provide insights into business strength.
| Metric | 2023 | 2024 | 2025 |
|---|---|---|---|
| Return on Equity | 8.17% | 10.61% | 10.58% |
| Return on Assets | 0.65% | 0.76% | 0.80% |
| Return on Invested Capital | 2.55% | 2.94% | 3.21% |
| Net Margin | 10.58% | 12.23% | 13.01% |
| EBIT Margin | 12.61% | 15.45% | 16.49% |
| EBITDA Margin | 17.41% | 18.20% | 18.94% |
| Gross Margin | 64.79% | 58.45% | 61.36% |
| R&D/Revenue | 0.00% | 0.00% | 0.00% |
With increasing profit margins and ROE, State Street demonstrates sound profitability and efficient use of capital, despite lagging R&D expenditure.
📉 Price Development
🎯 Dividend Scoring System
| Criterion | Score | Rating |
|---|---|---|
| Dividend yield | 3 | |
| Dividend Stability | 4 | |
| Dividend growth | 3 | |
| Payout ratio | 5 | |
| Financial stability | 4 | |
| Dividend continuity | 5 | |
| Cashflow Coverage | 3 | |
| Balance Sheet Quality | 4 |
Overall Score: 31/40
💡 Rating
State Street Corporation maintains robust dividend strength with a commitment to stability and growth. Despite some challenges in free cash flow management, the firm provides a reliable option for income-focused investors seeking moderate yet consistent returns. Recommended as a prudent addition to income portfolios.
Smart Data Insight
Master the Perfect Entry & Exit for this Stock
Don't leave your profits to chance. Historically, this stock follows specific seasonal patterns that institutional traders use to maximize returns.
- ✅ Identify the "Golden Buying Window"
- ✅ Avoid high-risk correction cycles
- ✅ Backtested data from the last 20+ years