May 16, 2026 a 02:46 am
STLD: Dividend Analysis - Steel Dynamics, Inc.
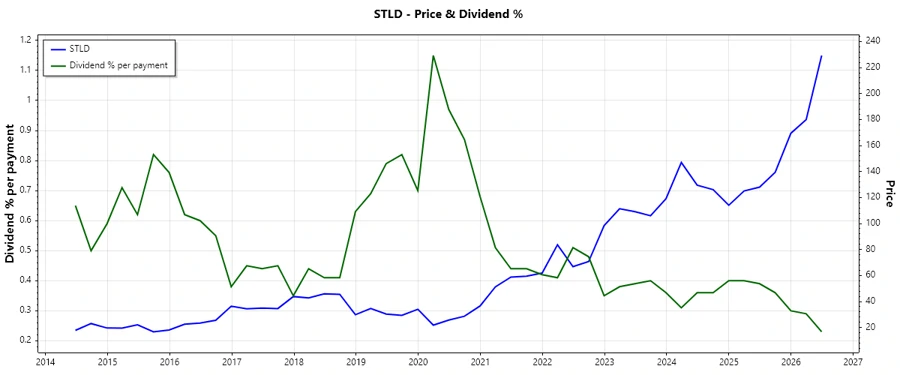
Steel Dynamics, Inc., a leader in the steel production sector, presents a robust dividend profile characterized by a consistent history of dividend payments and moderate growth. With a yield of approximately 0.90% and undisturbed dividend payment history across 23 years, it reflects a commitment to shareholder value.
📊 Overview
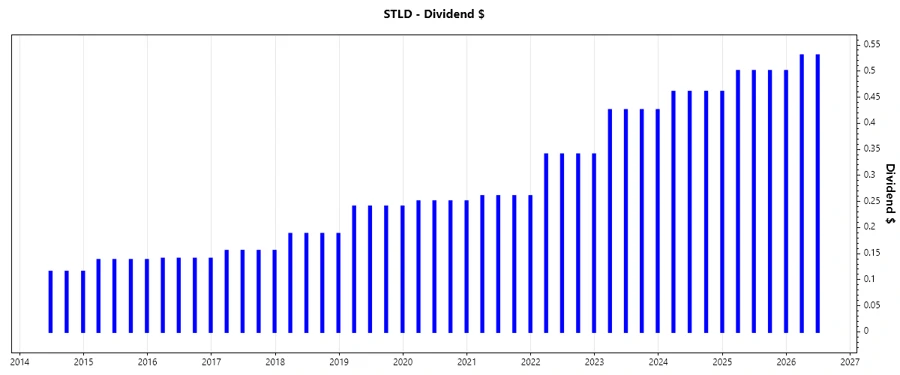
Steel Dynamics operates within a highly competitive sector characterized by fluctuating market conditions. The company's current dividend yield stands at a notable 0.90%, with a per-share dividend of $1.97. Its 23-year dividend history underscores stability, while an absence of recent cuts enhances investor confidence.
| Detail | Value |
|---|---|
| Sector | Steel Production |
| Dividend Yield | 0.90% |
| Current Dividend Per Share | 1.97 USD |
| Dividend History | 23 years |
| Last Cut or Suspension | None |
🗣️ Dividend History
The history of consistent dividend payouts enhances the attractiveness of Steel Dynamics to income-focused investors. The most recent trend reflects a steady and reliable payment track record.
| Year | Dividend Per Share (USD) |
|---|---|
| 2026 | 1.06 |
| 2025 | 2.00 |
| 2024 | 1.84 |
| 2023 | 1.70 |
| 2022 | 1.36 |
📈 Dividend Growth
Dividend growth rates are crucial indicators of a company's ability to enhance shareholder value through increased payouts. Over the past 3 and 5 years, Steel Dynamics has displayed a moderate growth trajectory, bolstering investor confidence.
| Time Frame | Growth |
|---|---|
| 3 years | 13.72% |
| 5 years | 14.87% |
The average dividend growth is 14.87% over 5 years. This shows moderate but steady dividend growth.
📉 Payout Ratio
The payout ratio is a critical measure of dividend sustainability. Steel Dynamics's EPS payout ratio at 20.79% and FCF payout ratio at 42.74% imply a balanced approach, suggesting room for growth and reduced risk of dividend reduction.
| Key Figure | Ratio |
|---|---|
| EPS-based | 20.79% |
| Free Cash Flow-based | 42.74% |
✅ Cashflow & Capital Efficiency
Evaluating cash flow and capital efficiency is essential for understanding operational effectiveness and the potential for value generation. The Free Cash Flow Yield has demonstrated variability, while the Earnings Yield indicates profitability.
| Metric | 2023 | 2024 | 2025 |
|---|---|---|---|
| Free Cash Flow Yield | 9.47% | -0.13% | 2.00% |
| Earnings Yield | 12.46% | 8.67% | 4.73% |
| CAPEX to Operating Cash Flow | 47.10% | 101.27% | 65.40% |
| Stock-based Compensation to Revenue | 0.33% | 0.38% | 0.17% |
| Free Cash Flow / Operating Cash Flow Ratio | 0.53 | -0.01 | 0.35 |
⚠️ Balance Sheet & Leverage Analysis
A strong balance sheet is foundational to financial resilience. Steel Dynamics exhibits a moderate Debt-to-Equity Ratio, enhancing its ability to meet obligations and leveraging potential for strategic initiatives.
| Metric | 2023 | 2024 | 2025 |
|---|---|---|---|
| Debt-to-Equity | 34.64% | 37.44% | 47.01% |
| Debt-to-Assets | 20.60% | 22.40% | 25.66% |
| Debt-to-Capital | 25.73% | 27.24% | 31.98% |
| Net Debt to EBITDA | 0.45 | 1.09 | 1.63 |
| Current Ratio | 2.91 | 2.53 | 3.13 |
| Quick Ratio | 1.67 | 1.08 | 1.29 |
| Financial Leverage | 1.68 | 1.67 | 1.83 |
✅ Fundamental Strength & Profitability
Evaluating core financial metrics is crucial for assessing a company’s profitability. Steel Dynamics has a consistent Return on Equity and is maintaining robust margins, indicating operational efficiency.
| Metric | 2023 | 2024 | 2025 |
|---|---|---|---|
| Return on Equity | 27.64% | 17.20% | 13.24% |
| Return on Assets | 16.44% | 10.29% | 7.22% |
| Net Margin | 13.04% | 8.76% | 6.52% |
| EBIT Margin | 17.53% | 11.63% | 8.60% |
| EBITDA Margin | 19.86% | 14.36% | 11.63% |
| Gross Margin | 21.53% | 15.98% | 13.01% |
| R&D to Revenue | 0.00% | 0.00% | 0.00% |
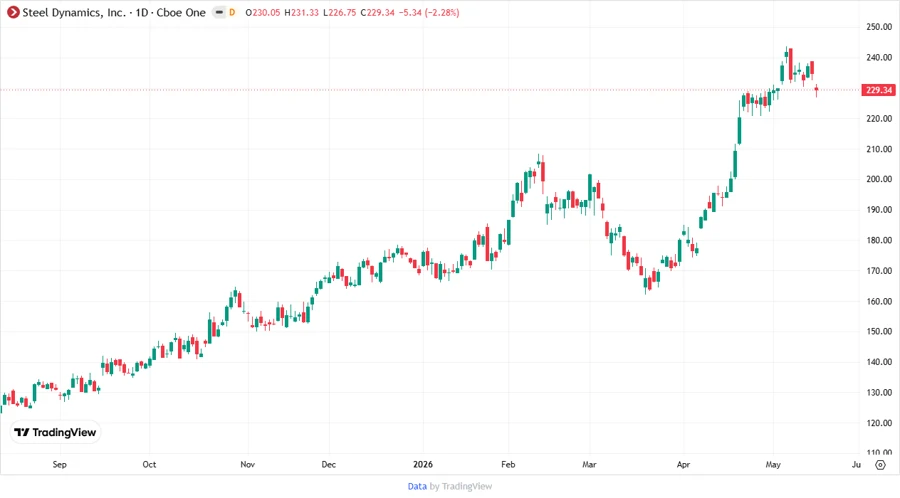
📈 Price Development
🔍 Dividend Scoring System
Based on the following criteria, Steel Dynamics achieves an impressive dividend score, demonstrating its alignment with dividend-focused investment strategies.
| Category | Score | Progress |
|---|---|---|
| Dividend Yield | 3 | |
| Dividend Stability | 5 | |
| Dividend Growth | 4 | |
| Payout Ratio | 4 | |
| Financial Stability | 4 | |
| Dividend Continuity | 5 | |
| Cashflow Coverage | 3 | |
| Balance Sheet Quality | 4 |
Overall Score: 32/40
🗣️ Rating
Steel Dynamics, Inc. stands out as a tempting proposition for dividend investors seeking consistent income delivery with prospects for moderate growth. While the yield might not be as high as some peers, the company's commitment to dividend growth and stability positions it as a solid long-term investment opportunity.
Smart Data Insight
Master the Perfect Entry & Exit for this Stock
Don't leave your profits to chance. Historically, this stock follows specific seasonal patterns that institutional traders use to maximize returns.
- ✅ Identify the "Golden Buying Window"
- ✅ Avoid high-risk correction cycles
- ✅ Backtested data from the last 20+ years