March 24, 2026 a 07:31 am
STLD: Dividend Analysis - Steel Dynamics, Inc.
Steel Dynamics, Inc. presents a robust dividend profile balanced with growth potential and sustainability. Positive dividend trends and sound financial health support its attractiveness for income-focused investors. A comprehensive analysis reveals the strengths underpinning its dividend policy.
📊 Overview
Steel Dynamics, Inc. operates within a strategic sector characterized by robust fundamentals. The company's dividend attributes highlight its strength and investor-favorability.
| Attribute | Detail |
|---|---|
| Sector | Materials |
| Dividend Yield | 1.22 % |
| Current Dividend Per Share | 1.97 USD |
| Dividend History | 23 years |
| Last Cut or Suspension | None |
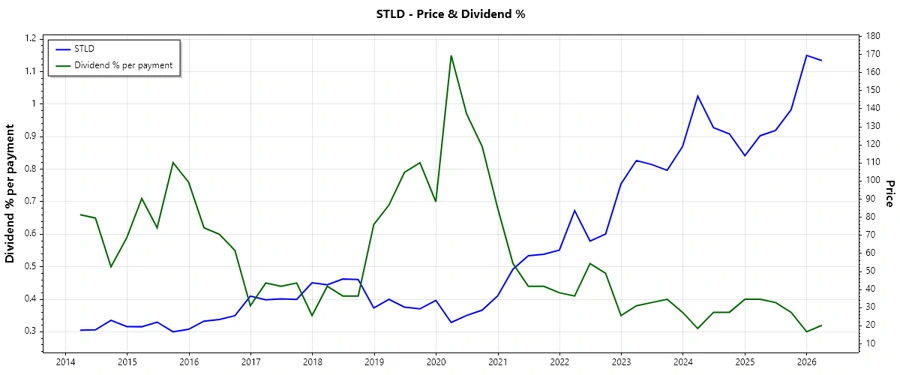
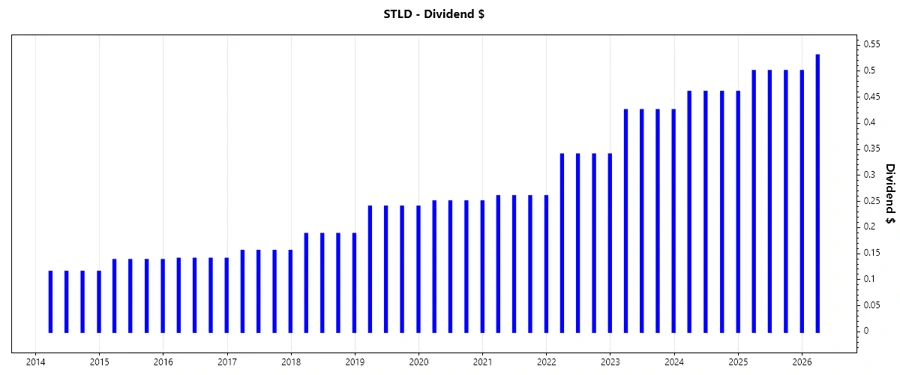
📈 Dividend History
The company’s dividend record is invaluable for trust-building and investor confidence. An uninterrupted 23-year history underscores its commitment to shareholder returns.
| Year | Dividend per Share (USD) |
|---|---|
| 2026 | 0.53 |
| 2025 | 2.00 |
| 2024 | 1.84 |
| 2023 | 1.70 |
| 2022 | 1.36 |
✅ Dividend Growth
Assessing dividend growth is crucial for gauging potential future income streams. Its formulation reflects the company’s operational and financial health in the long term.
| Time | Growth |
|---|---|
| 3 years | 13.72 % |
| 5 years | 14.87 % |
The average dividend growth is 14.87 % over 5 years. This shows moderate but steady dividend growth.
⚠️ Payout Ratio
A crucial metric indicating the percentage of earnings and cash flow distributed as dividends, revealing sustainability and potential for growth.
| Key Figure | Ratio |
|---|---|
| EPS-based | 24.20 % |
| Free Cash Flow-based | 57.35 % |
The EPS payout ratio of 24.20 % is healthy, suggesting retained earnings for growth, while the FCF payout of 57.35 % indicates efficient cash utilization.
🏦 Cashflow & Capital Efficiency
Analyzing cash flows and capital allocation efficiency provides insights into operational effectiveness and financial resilient capacity for sustaining dividends.
| Metric | 2023 | 2024 | 2025 |
|---|---|---|---|
| Free Cash Flow Yield | 9.47 % | -0.13 % | 2.00 % |
| Earnings Yield | 12.46 % | 8.67 % | 4.73 % |
| CAPEX to Operating Cash Flow | 47.10 % | 101.27 % | 65.40 % |
| Stock-based Compensation to Revenue | 0.33 % | 0.38 % | 0 % |
| Free Cash Flow / Operating Cash Flow Ratio | 52.90 % | -1.27 % | 34.60 % |
The stability of cash flow metrics alongside capital efficiency measures supports a strong foundation for ongoing dividend payments.
🗣️ Balance Sheet & Leverage Analysis
A solid balance sheet and prudent leverage are essential for company resilience, risk management, and long-term steadiness in dividend distributions.
| Metric | 2023 | 2024 | 2025 |
|---|---|---|---|
| Debt-to-Equity | 0.35 | 0.37 | 0.47 |
| Debt-to-Assets | 0.21 | 0.22 | 0.26 |
| Debt-to-Capital | 0.26 | 0.27 | 0.32 |
| Net Debt to EBITDA | 0.45 | 1.09 | 1.63 |
| Current Ratio | 2.91 | 2.53 | 3.06 |
| Quick Ratio | 1.67 | 1.08 | 1.29 |
| Financial Leverage | 1.68 | 1.67 | 1.83 |
Low leverage levels combined with healthy liquidity positions underline a robust financial framework supporting dividend stability.
🏅 Fundamental Strength & Profitability
Robust profitability influences a company’s sustainable dividend payout ability. Strong returns on equity and assets, coupled with wide margins, enhance the company’s dividend credibility.
| Metric | 2023 | 2024 | 2025 |
|---|---|---|---|
| Return on Equity | 27.64 % | 17.20 % | 13.24 % |
| Return on Assets | 16.44 % | 10.29 % | 7.22 % |
| Margins: Net | 13.04 % | 8.76 % | 6.52 % |
| EBIT | 17.53 % | 11.63 % | 8.60 % |
| EBITDA | 19.86 % | 14.36 % | 11.63 % |
| Gross | 21.53 % | 15.98 % | 13.01 % |
| Research & Development to Revenue | 0 % | 0 % | 0 % |
The attractive profitability metrics paint a picture of a company well-positioned to sustain and potentially raise dividends.
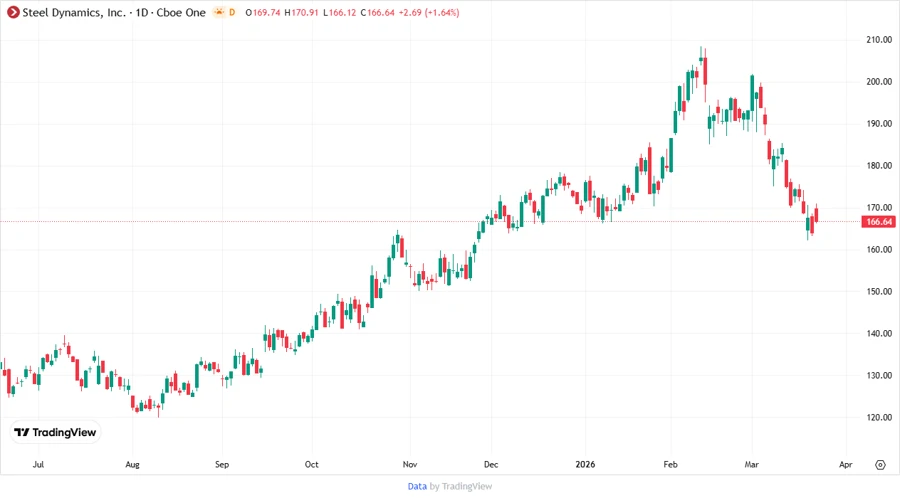
📉 Price Development
📊 Dividend Scoring System
| Criteria | Score | Score Bar |
|---|---|---|
| Dividend Yield | 3 | |
| Dividend Stability | 4 | |
| Dividend Growth | 3 | |
| Payout Ratio | 4 | |
| Financial Stability | 5 | |
| Dividend Continuity | 5 | |
| Cashflow Coverage | 3 | |
| Balance Sheet Quality | 4 |
Total Score: 31/40
🏅 Rating
Steel Dynamics, Inc. exhibits a balanced dividend profile supported by firm financial underpinnings, moderate growth, and resilient operational metrics. It offers a compelling investment opportunity for dividend-seeking investors, underscored by its overall financial health and strategic resource allocation.
Smart Data Insight
Master the Perfect Entry & Exit for this Stock
Don't leave your profits to chance. Historically, this stock follows specific seasonal patterns that institutional traders use to maximize returns.
- ✅ Identify the "Golden Buying Window"
- ✅ Avoid high-risk correction cycles
- ✅ Backtested data from the last 20+ years