February 18, 2026 a 03:31 am


STLD: Dividend Analysis - Steel Dynamics, Inc.
Steel Dynamics, Inc. (STLD) exhibits a robust dividend profile characterized by consistent growth and impressive yield stability. With over two decades of dividend payment history, STLD stands as a reliable dividend payer in the industrial sector, reflecting strategic financial management and robust business performance.
Overview 📊
| Category | Details |
|---|---|
| Sector | Industrial Metals & Mining |
| Dividend yield | 1.18% |
| Current dividend per share | 1.97 USD |
| Dividend history | 22 years |
| Last cut or suspension | 2010 |
Dividend History 🗣️
With a 22-year unbroken streak of dividend payments, Steel Dynamics, Inc. has demonstrated commendable resilience in its payout policy. This indicates strong earnings performance and a commitment to returning value to shareholders.
| Year | Dividend per Share (USD) |
|---|---|
| 2025 | 2.00 |
| 2024 | 1.84 |
| 2023 | 1.70 |
| 2022 | 1.36 |
| 2021 | 1.04 |
Dividend Growth 📈
The dividend growth over the past years signals a promising upward trajectory. Such growth is critical for investors seeking increasing income flows.
| Time | Growth |
|---|---|
| 3 years | 13.72% |
| 5 years | 14.87% |
The average dividend growth is 14.87% over 5 years. This shows moderate but steady dividend growth.
Payout Ratio ✅
The payout ratio is a vital indicator of dividend sustainability. A lower ratio often implies more room for dividend increases.
| Key figure ratio | Percentage |
|---|---|
| EPS-based | 24.20% |
| Free cash flow-based | 57.36% |
With an EPS payout ratio of 24.20% and a FCF payout ratio of 57.36%, Steel Dynamics effectively balances dividend payouts without over-leveraging its cash flows.
Cashflow & Capital Efficiency 💰
Understanding cashflow and capital efficiency is crucial to gauging the health of a company's operations and its ability to sustain dividends.
| Year | 2025 | 2024 | 2023 |
|---|---|---|---|
| Free Cash Flow Yield | 2.00% | -0.13% | 9.47% |
| Earnings Yield | 4.73% | 8.67% | 12.46% |
| CAPEX to Operating Cash Flow | 65.40% | 101.27% | 47.10% |
| Stock-based Compensation to Revenue | 0.17% | 0.38% | 0.33% |
| Free Cash Flow / Operating Cash Flow Ratio | 34.60% | -1.27% | 52.90% |
Steel Dynamics demonstrates solid capital efficiencies with healthy operating cashflows and judicious investment, ensuring strong liquidity and robust asset utilization.
Balance Sheet & Leverage Analysis ⚖️
Thorough balance sheet analysis provides insights into the financial stability and debt management strategies of the company.
| Year | 2025 | 2024 | 2023 |
|---|---|---|---|
| Debt-to-Equity | 47.01% | 37.44% | 34.64% |
| Debt-to-Assets | 25.66% | 22.40% | 20.60% |
| Debt-to-Capital | 31.98% | 27.24% | 25.73% |
| Net Debt to EBITDA | 1.63 | 1.09 | 0.45 |
| Current Ratio | 3.06 | 2.53 | 2.91 |
| Quick Ratio | 1.29 | 1.08 | 1.67 |
| Financial Leverage | 1.83 | 1.67 | 1.68 |
The corporation showcases a commendable debt strategy, maintaining low leverage ratios which bodes well for its long-term solvency and liquidity.
Fundamental Strength & Profitability 📉
These metrics reveal profitability, operating efficiency, and the fundamental strength that support long-term financial health.
| Year | 2025 | 2024 | 2023 |
|---|---|---|---|
| Return on Equity | 13.24% | 17.20% | 27.64% |
| Return on Assets | 7.22% | 10.29% | 16.44% |
| Margins: Net | 6.52% | 8.76% | 13.04% |
| EBIT Margin | 8.60% | 11.63% | 17.53% |
| EBITDA Margin | 11.63% | 14.36% | 19.86% |
| Gross Margin | 13.01% | 15.98% | 21.53% |
Steel Dynamics' operating margins and returns reflect adept market positioning and operational proficiency, instrumental in sustaining competitive advantage.
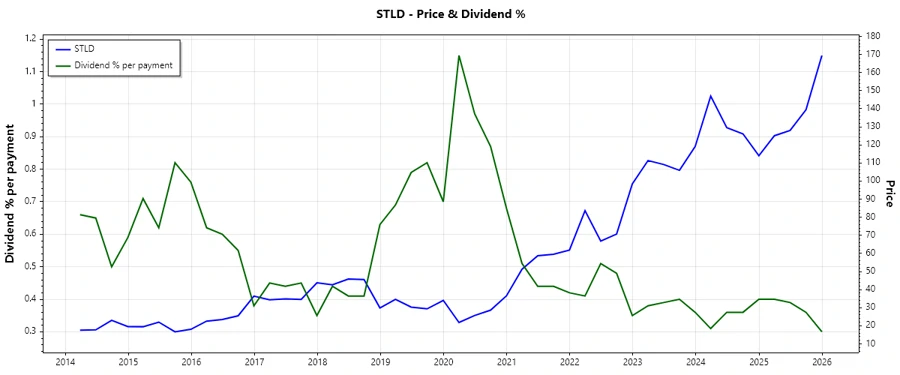
Price Development 📉
Dividend Scoring System 🏆
| Category | Score | Visual |
|---|---|---|
| Dividend yield | 3 | |
| Dividend Stability | 4 | |
| Dividend growth | 4 | |
| Payout ratio | 4 | |
| Financial stability | 5 | |
| Dividend continuity | 5 | |
| Cashflow Coverage | 4 | |
| Balance Sheet Quality | 5 |
Total Score: 34/40
Rating 🗣️
Steel Dynamics, Inc. presents itself as a solid investment for dividend-seeking investors, offering stability with respectable growth prospects. With a proven track record and sound financial metrics, it's poised for continued success. Recommended for investors prioritizing income and capital appreciation.