February 05, 2026 a 07:46 am

STLD: Dividend Analysis - Steel Dynamics, Inc.
Steel Dynamics, Inc. exhibits a solid dividend profile, characterized by a stable payout history and robust financial metrics. Notably, it maintains a sustainable dividend yield aligned with consistent growth, which speaks to the company's ability to persevere in challenging market conditions. Its strategic positioning and operational efficiency underscore its reliability as a dividend stock.
📊 Overview
This section provides a snapshot of the essential metrics reflecting the dividend-paying behavior of Steel Dynamics, Inc., highlighting critical financial parameters.
| Metric | Details |
|---|---|
| Sector | Metals & Mining |
| Dividend Yield | 1.18% |
| Current Dividend Per Share | $1.97 |
| Dividend History | 22 years |
| Last Cut or Suspension | 2010 |
🗣️ Dividend History
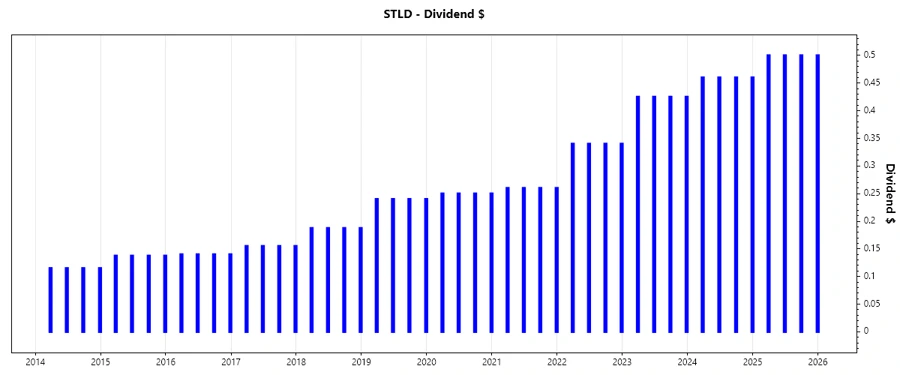
Steel Dynamics, Inc. has shown resilience in maintaining consistent dividend growth over the years, an indicator of management’s commitment to returning value to shareholders. This historical reliability is a keystone for investor confidence.
| Year | Dividend per Share (USD) |
|---|---|
| 2025 | 2.00 |
| 2024 | 1.84 |
| 2023 | 1.70 |
| 2022 | 1.36 |
| 2021 | 1.04 |
📈 Dividend Growth
The growth in dividends over the specified periods reflects the company's financial health and proactive dividend policy, providing assurance of future increments to stakeholders.
| Time | Growth |
|---|---|
| 3 years | 13.72% |
| 5 years | 14.87% |
The average dividend growth is 14.87% over 5 years. This shows moderate but steady dividend growth.
📉 Payout Ratio
Payout ratios evaluate how effectively a firm turns profits into dividends, crucial for sustainability assessments. An optimal ratio indicates a balance between returning capital to shareholders and reinvesting in growth opportunities.
| Key figure | Ratio |
|---|---|
| EPS-based | 24.20% |
| Free cash flow-based | 57.36% |
The EPS payout ratio at 24.20% is conservative, allowing room for future increases. Conversely, the FCF payout ratio at 57.36% suggests a more ample dividend return, backed by cash flow stability.
✅ Cashflow & Capital Efficiency
Understanding cash flow metrics is pivotal; they assess the enterprise's capability to cover dividends and fund expansion. Efficient capital allocation translates into sustainable growth and enhanced shareholder returns.
| Metric | 2023 | 2024 | 2025 |
|---|---|---|---|
| Free Cash Flow Yield | 9.47% | -0.13% | 2.00% |
| Earnings Yield | 12.46% | 8.67% | 4.73% |
| CAPEX to Operating Cash Flow | 47.10% | 101.27% | 65.40% |
| Stock-based Compensation to Revenue | 0.33% | 0.38% | 0% |
| Free Cash Flow / Operating Cash Flow Ratio | 52.90% | -1.27% | 34.60% |
With a robust Free Cash Flow in 2023, the company demonstrates its ability to generate cash beyond its obligations, though challenges in 2024 highlight the need for cautious optimism regarding capital expenditures.
⚠️ Balance Sheet & Leverage Analysis
A thorough analysis of the company’s leverage and liquidity ratios provides insights into its capacity to meet financial obligations withstanding adverse market situations.
| Metric | 2023 | 2024 | 2025 |
|---|---|---|---|
| Debt-to-Equity | 34.64% | 37.44% | 47.01% |
| Debt-to-Assets | 20.60% | 22.40% | 25.66% |
| Debt-to-Capital | 25.73% | 27.24% | 31.98% |
| Net Debt to EBITDA | 0.45x | 1.09x | 1.63x |
| Current Ratio | 2.91x | 2.53x | 3.06x |
| Quick Ratio | 1.67x | 1.08x | 1.29x |
| Financial Leverage | 1.68x | 1.67x | 1.83x |
Overall, the balance sheet reflects a stable leverage position, accentuated by a comfortable current ratio, granting Steel Dynamics leeway in financial maneuverability.
✅ Fundamental Strength & Profitability
Evaluating profitability ratios help in gauging fiscal health. Profit margins and returns ratio are crucial as they reveal operational performance and financial stability.
| Metric | 2023 | 2024 | 2025 |
|---|---|---|---|
| Return on Equity | 27.64% | 17.20% | 13.24% |
| Return on Assets | 16.44% | 10.29% | 7.22% |
| Margins: Net, EBIT, EBITDA, Gross | 13.04%, 17.53%, 19.86%, 21.53% | 8.76%, 11.63%, 14.36%, 15.98% | 6.52%, 8.60%, 11.63%, 13.01% |
| Research & Development to Revenue | 0% | 0% | 0% |
While the company's strong ROE in 2023 demonstrates robust profitability, a downward trend signifies potential efficiencies that need to be addressed to sustain high returns in dynamic market environments.
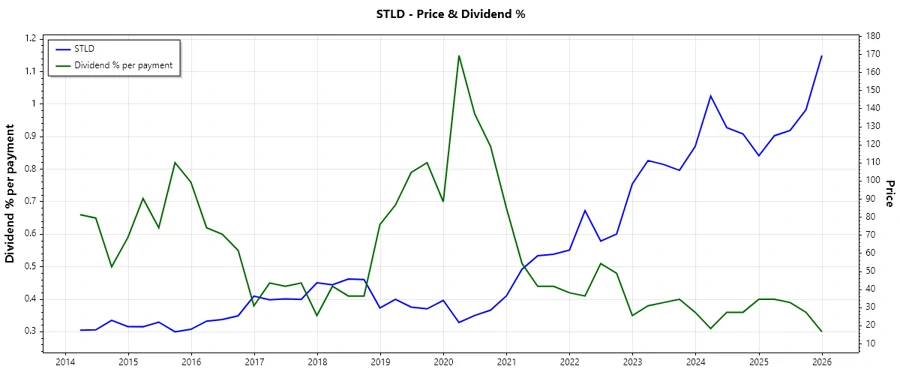
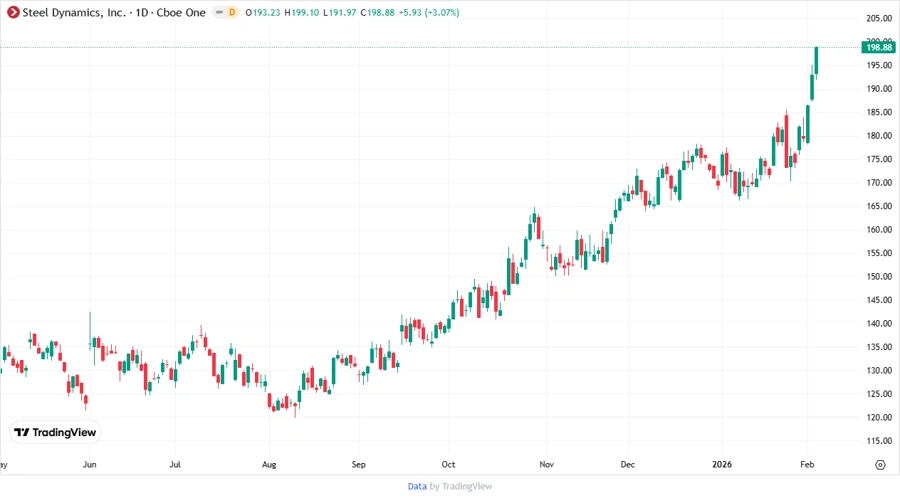
Price Development
💡 Dividend Scoring System
Our scoring system assesses the dividend-paying ability and sustainability of Steel Dynamics, Inc. across multiple parameters.
| Criteria | Score (out of 5) | Description |
|---|---|---|
| Dividend yield | 3 | |
| Dividend Stability | 4 | |
| Dividend growth | 4 | |
| Payout ratio | 5 | |
| Financial stability | 4 | |
| Dividend continuity | 5 | |
| Cashflow Coverage | 4 | |
| Balance Sheet Quality | 4 |
Overall Score: 33 out of 40
🔍 Rating & Conclusion
Steel Dynamics, Inc. demonstrates itself as a formidable dividend-paying entity, maintaining growth alongside stability, indicative of an appealing choice for income-focused investors seeking consistent returns. Its robust financial structure and strategic market presence foster confidence in sustained payout augmentation, warranting a cautious but positive outlook.