February 01, 2026 a 07:31 am

STLD: Dividend Analysis - Steel Dynamics, Inc.
Steel Dynamics, Inc. shows a diversified and strong dividend profile backed by robust financials. With a sustained dividend history and growing distributions, the company has managed to deliver shareholder value consistently. The relatively low payout ratios suggest room for further dividend growth, aligning with their strategic growth plans.
📊 Overview
Steel Dynamics operates within the Metals & Mining sector, providing stability through their commitment to dividends.
| Metric | Value |
|---|---|
| Sector | Metals & Mining |
| Dividend yield | 1.18 % |
| Current dividend per share | 1.97 USD |
| Dividend history | 22 years |
| Last cut or suspension | 2010 |
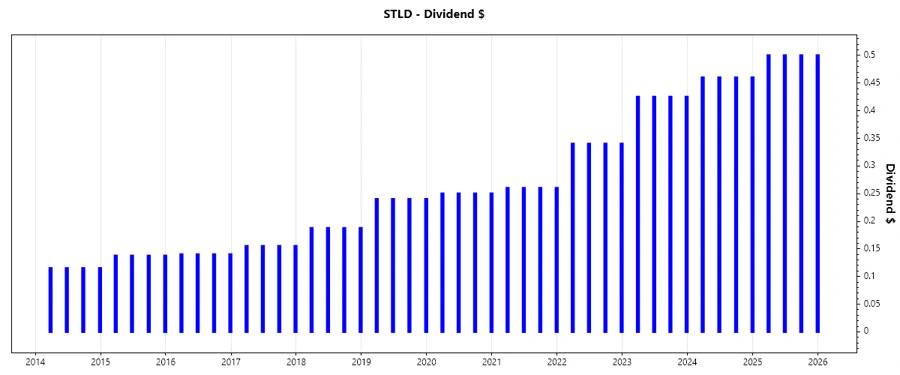
🗣️ Dividend History
Consistency in dividends is key for investor confidence. Steel Dynamics has a 22-year streak of paying dividends, indicating resilience and commitment.
| Year | Dividend per Share (USD) |
|---|---|
| 2025 | 2.0 |
| 2024 | 1.84 |
| 2023 | 1.70 |
| 2022 | 1.36 |
| 2021 | 1.04 |
📈 Dividend Growth
Dividend growth showcases the company's potential to enhance shareholder returns. Steel Dynamics has witnessed a moderate dividend increase over recent years.
| Time | Growth |
|---|---|
| 3 years | 13.72 % |
| 5 years | 14.87 % |
The average dividend growth is 14.87 % over 5 years. This demonstrates moderate but steady dividend growth.
✅ Payout Ratio
Efficient payout ratios point to sustainable financial practices. The company maintains low EPS-based and moderate FCF-based ratios, indicating fiscal prudence.
| Key figure | Ratio |
|---|---|
| EPS-based | 24.20 % |
| Free cash flow-based | 57.36 % |
With an EPS payout ratio of 24.20% and a FCF payout ratio of 57.36%, Steel Dynamics displays a balanced approach, prioritizing sustainable dividend distributions.
💸 Cashflow & Capital Efficiency
Understanding cash flow metrics is crucial for assessing a company's ability to fund operations and dividends. Steel Dynamics exhibits strong efficiency in capital deployment.
| Metric | 2023 | 2024 | 2025 |
|---|---|---|---|
| Free Cash Flow Yield | 9.47 % | -0.13 % | 2.00 % |
| Earnings Yield | 12.46 % | 8.67 % | 4.73 % |
| CAPEX to Operating Cash Flow | 47.10 % | 101.27 % | 65.40 % |
| Stock-based Compensation to Revenue | 0.33 % | 0.38 % | 0.17 % |
| Free Cash Flow / Operating Cash Flow Ratio | 52.90 % | -1.27 % | 34.60 % |
Steel Dynamics demonstrates robust cash flow stability and capital efficiency, crucial indicators of a business's ability to sustain growth and dividends.
📊 Balance Sheet & Leverage Analysis
Analyzing balance sheet health is essential for assessing risk and leverage. Steel Dynamics maintains a prudent leverage position, enhancing financial stability.
| Metric | 2023 | 2024 | 2025 |
|---|---|---|---|
| Debt-to-Equity | 34.64 % | 37.44 % | 47.01 % |
| Debt-to-Assets | 20.60 % | 22.40 % | 25.66 % |
| Debt-to-Capital | 25.73 % | 27.24 % | 31.98 % |
| Net Debt to EBITDA | 0.45 | 1.09 | 1.63 |
| Current Ratio | 2.91 | 2.53 | 3.06 |
| Quick Ratio | 1.67 | 1.08 | 1.29 |
| Financial Leverage | 1.68 | 1.67 | 1.83 |
Steel Dynamics' conservative financial leverage and healthy ratios suggest strong liquidity and stability to meet obligations and sustain growth.
📈 Fundamental Strength & Profitability
An evaluation of profitability metrics helps determine the company's operational efficiency and market competitiveness.
| Metric | 2023 | 2024 | 2025 |
|---|---|---|---|
| Return on Equity | 27.64 % | 17.20 % | 13.24 % |
| Return on Assets | 16.44 % | 10.29 % | 7.22 % |
| Net Margin | 13.04 % | 8.76 % | 6.52 % |
| EBIT Margin | 17.53 % | 11.63 % | 8.60 % |
| EBITDA Margin | 19.86 % | 14.36 % | 11.63 % |
| Gross Margin | 21.53 % | 15.98 % | 13.01 % |
| R&D to Revenue | 0.00 % | 0.00 % | 0.00 % |
The company's solid margins and return metrics illustrate efficiency in maximizing shareholder value.
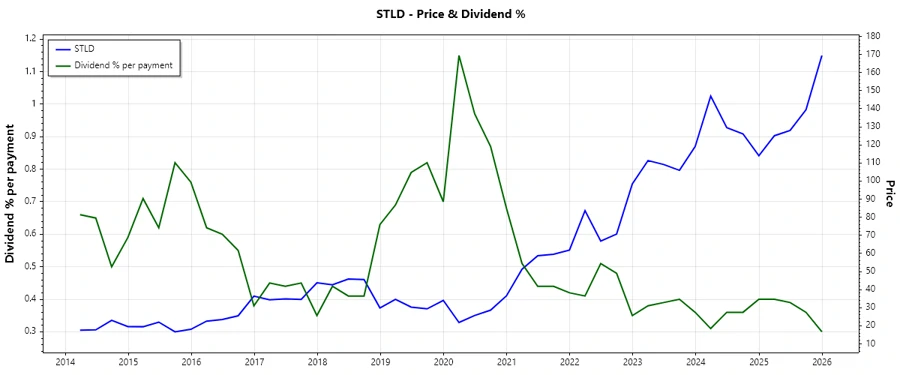
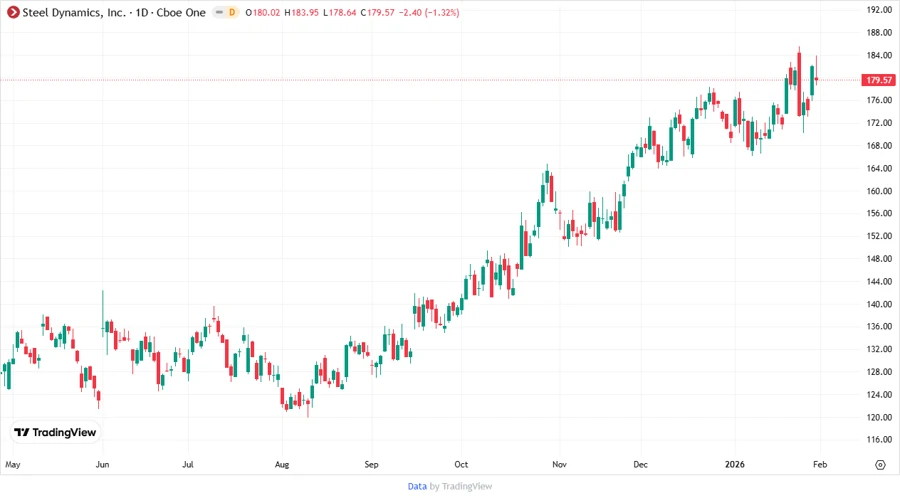
📉 Price Development
🗳️ Dividend Scoring System
| Criteria | Score | Score Bar |
|---|---|---|
| Dividend yield | 3 | |
| Dividend Stability | 5 | |
| Dividend growth | 4 | |
| Payout ratio | 4 | |
| Financial stability | 5 | |
| Dividend continuity | 5 | |
| Cashflow Coverage | 4 | |
| Balance Sheet Quality | 5 |
Total Score: 35/40
🛠️ Rating
Steel Dynamics, Inc. boasts a robust dividend profile, underscored by strong fundamentals and consistent dividend history. With prudent financial management and a favorable growth trajectory, the company offers an attractive prospect for dividend-focused investors. Recommend Buy for long-term dividend growth.