October 28, 2025 a 07:46 am

STLD: Dividend Analysis - Steel Dynamics, Inc.
Steel Dynamics, Inc., recognized for its substantial position in the steel production sector, displays a promising dividend yield, underpinned by consistent historical payouts over 22 years. The firm maintains a reasonable payout ratio, indicating a cautious approach to dividend policy, ensuring commitments can be fulfilled without compromising growth opportunities. Investors can anticipate a combination of income and capital appreciation, thanks to steady earnings and disciplined financial management.
📊 Overview
Steel Dynamics has firmly established itself within the sector, boasting a commendable dividend yield of 1.41%. Its current dividend per share stands at USD 1.82, signifying a robust commitment to shareholders. Over two decades of dividend history illustrate the firm’s reliability, with no recent cuts or suspensions recorded.
| Metric | Value |
|---|---|
| Sector | Steel Production |
| Dividend Yield | 1.41% |
| Current Dividend per Share | $1.82 |
| Dividend History | 22 years |
| Last Cut/Suspension | None |
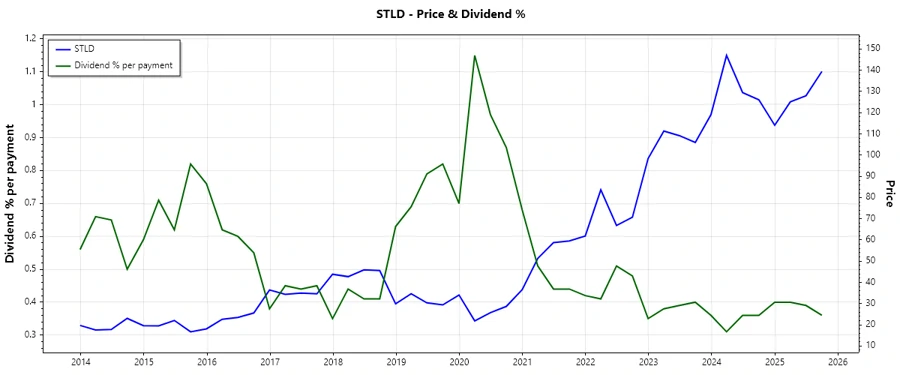
🗣️ Dividend History
The longevity and consistency of Steel Dynamics' dividend payments highlight its commitment to rewarding shareholders. This track record is a potent indicator of financial stability and operational excellence. Understanding historical payouts aids in projecting future trends and building confidence in sustained income streams.
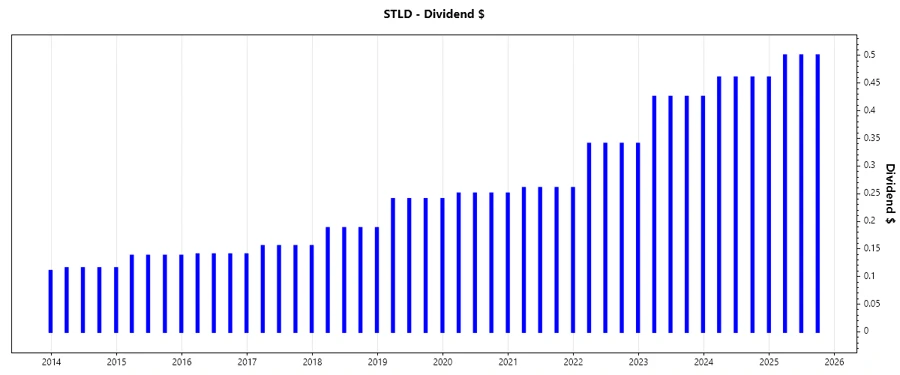
| Year | Dividend Per Share (USD) |
|---|---|
| 2025 | $1.50 |
| 2024 | $1.84 |
| 2023 | $1.70 |
| 2022 | $1.36 |
| 2021 | $1.04 |
📈 Dividend Growth
An analysis of Steel Dynamics reveals a 3-year dividend growth rate of 20.95% and a 5-year rate of 13.90%. Such figures suggest a robust commitment to return enhancements, albeit within controlled and sustainable limits. Investors stand to benefit from these incremental increases as part of a broader value growth strategy.
| Time | Growth |
|---|---|
| 3 years | 20.95% |
| 5 years | 13.90% |
The average dividend growth is 13.90% over 5 years. This shows moderate but steady dividend growth.
🔢 Payout Ratio
Payout ratios are integral to understanding how a company’s earnings are being distributed as dividends versus reinvested for growth. For Steel Dynamics, the EPS-based payout ratio is 23.71%, indicating a conservative dividend policy, which can foster future growth opportunities. Conversely, the FCF-based payout ratio at 86.07% might suggest less room for maneuvers through free cash flows.
| Key Figure | Ratio |
|---|---|
| EPS-based | 23.71% |
| Free cash flow-based | 86.07% |
The EPS-based payout ratio suggests that Steel Dynamics can sustain its dividend payments, although the high FCF-based ratio requires careful consideration of future cash flow management.
📊 Cashflow & Capital Efficiency
Cashflow and capital efficiency metrics display the operational proficiency and financial prudence of a company. For instance, Steel Dynamics shows varying free cash flow yields and CAPEX to operating cash flow ratios, reflecting its adaptive strategies to balance reinvestment and shareholder remuneration.
| Metric | 2024 | 2023 | 2022 |
|---|---|---|---|
| Free Cash Flow Yield | -0.13% | 9.47% | 19.82% |
| Earnings Yield | 8.67% | 12.46% | 21.56% |
| CAPEX to Operating Cash Flow | 101.27% | 47.10% | 20.38% |
| Stock-based Compensation to Revenue | 0.38% | 0.33% | 0.27% |
| Free Cash Flow / Operating Cash Flow Ratio | -1.27% | 52.90% | 79.62% |
The cash flow performance indicates a solid strategic alignment for capital allocation, ensuring healthy free cash flow generation relative to operational cash flows. This is further complemented by moderate capital expenditure outlays.
💰 Balance Sheet & Leverage Analysis
Examination of balance sheet strength and leverage offers insights into financial stability. With a manageable debt-to-equity ratio and notable interest coverage, Steel Dynamics maintains robust liquidity through proficient management of liabilities and capital.
| Metric | 2024 | 2023 | 2022 |
|---|---|---|---|
| Debt-to-Equity | 37.44% | 34.64% | 37.77% |
| Debt-to-Assets | 22.40% | 20.60% | 21.68% |
| Debt-to-Capital | 27.24% | 25.73% | 27.41% |
| Net Debt to EBITDA | 1.09 | 0.45 | 0.26 |
| Current Ratio | 3.11 | 2.91 | 3.76 |
| Quick Ratio | 1.08 | 1.67 | 2.22 |
| Financial Leverage | 1.67 | 1.68 | 1.74 |
The leverage ratios reflect a strong capacity to service debts, with ample coverage and an adept balance in leveraging operations for growth while maintaining liquidity.
📊 Fundamental Strength & Profitability
Fundamentals highlight the profitability and operational efficiency that defines Steel Dynamics. With substantial return metrics and healthy margins, the company demonstrates an ability to generate profits and reinvest effectively.
| Metric | 2024 | 2023 | 2022 |
|---|---|---|---|
| Return on Equity | 17.20% | 27.64% | 47.51% |
| Return on Assets | 10.29% | 16.44% | 27.28% |
| Margins - Net | 8.76% | 13.04% | 17.35% |
| Margins - EBIT | 11.63% | 17.53% | 22.97% |
| Margins - EBITDA | 14.36% | 19.86% | 24.69% |
| Margins - Gross | 15.98% | 21.53% | 27.48% |
| Research & Development to Revenue | 0% | 0% | 0% |
The company’s consistent high returns and margins point to efficient management and strong competitive positioning, which enable steady profitability and reinvestment ability.
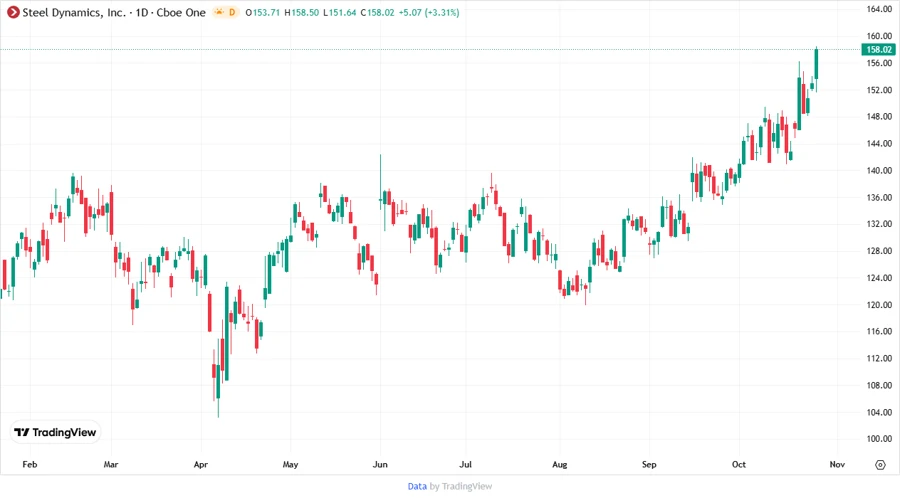
📉 Price Development
✅ Dividend Scoring System
| Criterion | Score | Score Bar |
|---|---|---|
| Dividend Yield | 3 | |
| Dividend Stability | 5 | |
| Dividend Growth | 4 | |
| Payout Ratio | 4 | |
| Financial Stability | 5 | |
| Dividend Continuity | 5 | |
| Cashflow Coverage | 3 | |
| Balance Sheet Quality | 4 |
Overall Score: 33/40
Rating
Steel Dynamics, Inc. offers a compelling dividend profile characterized by stability and moderate growth. The company demonstrates prudent financial management with a focus on maintaining a healthy balance sheet and prolific cash flow practices, supporting continuous shareholder returns. Given these robust financials, the stock is a strong candidate for investors seeking reliable income alongside potential capital appreciation.
Smart Data Insight
Master the Perfect Entry & Exit for this Stock
Don't leave your profits to chance. Historically, this stock follows specific seasonal patterns that institutional traders use to maximize returns.
- ✅ Identify the "Golden Buying Window"
- ✅ Avoid high-risk correction cycles
- ✅ Backtested data from the last 20+ years