February 06, 2026 a 09:03 am
STE: Trend and Support & Resistance Analysis - STERIS plc
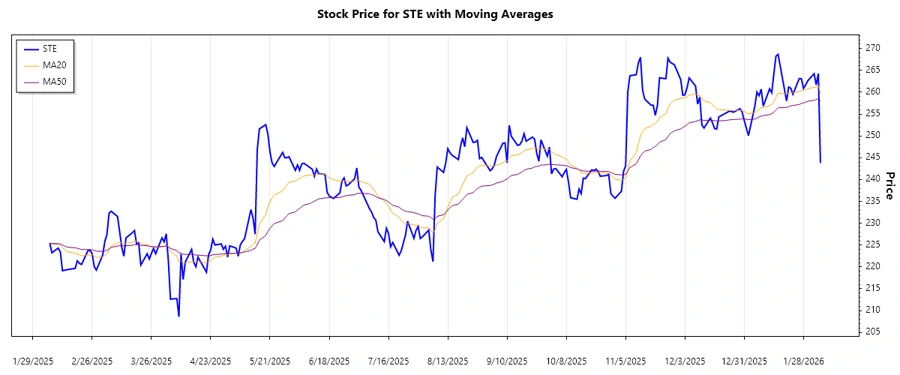
STERIS plc, a leader in infection prevention and other procedural products and services, has shown varied performance over the past months. The stock has experienced fluctuations that require careful technical analysis. Over the most recent period, the stock displayed recently a dominant upward trend. Evaluating key support and resistance levels further provides insight into potential strategic movements in the stock's price.
Trend Analysis
| Date | Closing Price | Trend |
|---|---|---|
| 2026-02-05 | 243.81 | ▼ |
| 2026-02-04 | 264.27 | ▲ |
| 2026-02-03 | 261.67 | ▲ |
| 2026-02-02 | 264.24 | ▲ |
| 2026-01-30 | 262.60 | ► |
| 2026-01-29 | 261.64 | ► |
| 2026-01-28 | 260.86 | ► |
The recent upward movement in the EMA calculations indicates a noteworthy bullish sentiment. This suggests a potential continuation of the upward trend, yet caution is advisable due to volatility signals.
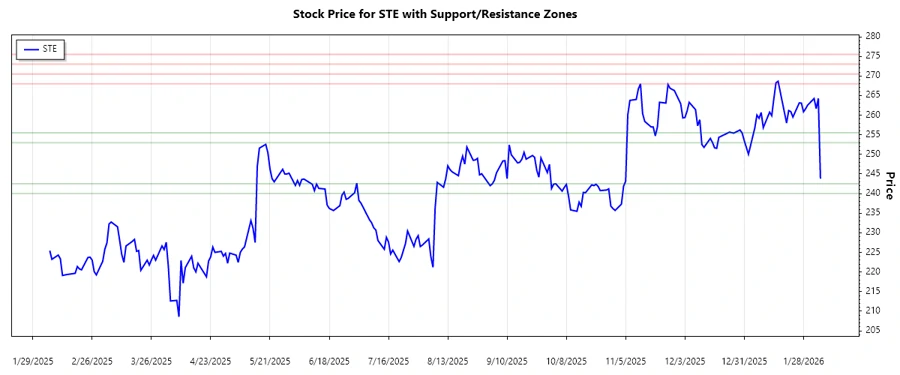
Support and Resistance
| Type | Zone From | Zone To |
|---|---|---|
| Support | 240.00 | 242.50 |
| Support | 253.00 | 255.50 |
| Resistance | 268.00 | 270.50 |
| Resistance | 273.00 | 275.50 |
The current price levels suggest proximity to a resistance zone. This warrants close observation for potential reversals or breakout opportunities.
Conclusion
STERIS plc exhibits promising technical indicators pointing towards a steady upward trend. Key support and resistance levels highlight potential areas for strategic decision-making. Despite the positive outlook, market participants should remain vigilant to any fundamental changes or news events that could impact momentum. This analysis not only provides insight into current price trends but also composes a foundation for potential opportunities and risks for investors keeping an eye on STERIS plc's future price movements.