July 02, 2026 a 06:44 am

STE: Fibonacci Analysis - STERIS plc
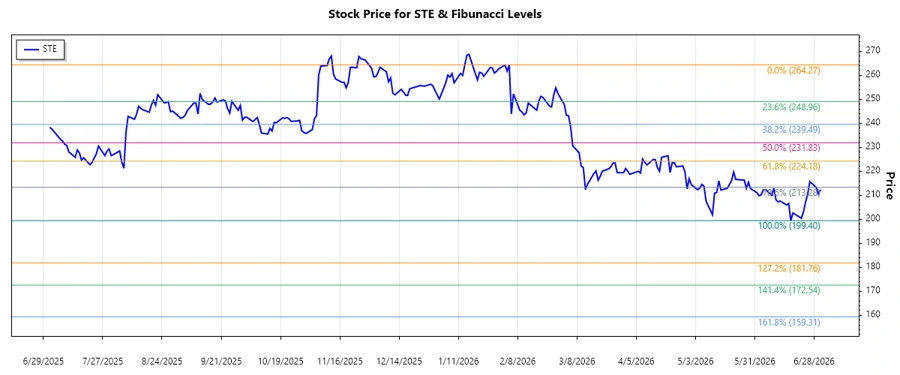
STERIS plc has been identified in a current downtrend, indicating a shift in market sentiment. As a provider of infection prevention products, its market position remains strong, but recent technical signals suggest caution. Using Fibonacci analysis, key retracement levels provide insight into potential support or continuation of the bearish momentum.
Fibonacci Analysis
| Detail | Value |
|---|---|
| Start Date | 2026-02-04 |
| End Date | 2026-07-01 |
| High Point | $264.27 on 2026-02-04 |
| Low Point | $199.4 on 2026-06-17 |
| Fibonacci Levels |
|
| Current Retracement Level | None |
| Technical Interpretation | The stock is not currently within a defined Fibonacci retracement level, suggesting potential for further downward movement if previous lows do not hold as support. |
Conclusion
The analysis of STERIS plc's stock indicates a prevailing bearish trend, with key Fibonacci levels suggesting potential areas for support. However, the current price does not align with any major retracement level, indicating continued volatility and a potential for further declines. Analysts should watch for support around the 0.236 level, with risk of momentum shifts if breached. Continued observation of fundamental performance and market conditions is advised, as external factors could influence future price movements and trend reversals.
Smart Data Insight
Master the Perfect Entry & Exit for this Stock
Don't leave your profits to chance. Historically, this stock follows specific seasonal patterns that institutional traders use to maximize returns.
- ✅ Identify the "Golden Buying Window"
- ✅ Avoid high-risk correction cycles
- ✅ Backtested data from the last 20+ years