August 27, 2025 a 06:45 am
STE: Fibonacci Analysis - STERIS plc
STERIS plc, a leader in infection prevention technologies, has shown potential for stable performance. Its diverse product range across multiple healthcare sectors positions it well in an ever-growing market. Recent historical price movements indicate notable volatility, making it ripe for technical analysis to assess potential investment risks and rewards.
Fibonacci Analysis
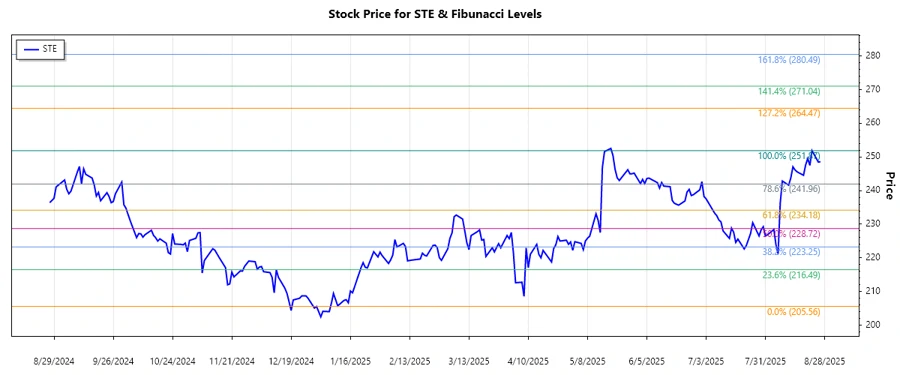
The analysis period shows a clear uptrend for STERIS plc from June 10, 2025, with a distinct peak on August 22, 2025, followed by slight retracement movements.
| Aspect | Details |
|---|---|
| Start Date | 2025-06-10 |
| End Date | 2025-08-22 |
| High Price | $251.87 (2025-08-22) |
| Low Price | $205.56 (2024-12-31) |
Fibonacci Retracement Levels:
| Retracement Level | Price |
|---|---|
| 0.236 | $231.77 |
| 0.382 | $221.83 |
| 0.5 | $214.46 |
| 0.618 | $207.09 |
| 0.786 | $196.44 |
The current price of $248.48 is near the peak and well above the highest retracement level, 0.236. This suggests that the current price is not in a traditional retracement zone and indicates strong upward momentum.
The recent price action indicates significant support around the 0.236 retracement level. Any pullback may find support in this range, with movement above current highs signaling further bullish potential.
Conclusion
STERIS plc's strong upward trend highlights its potential as a resilient investment, underpinned by its leadership in infection control. The lack of retracement into Fibonacci zones suggests sustained upward pressure, yet investors should heed the potential for short-term volatility especially at key support levels. Analysts eye continued strength in key market areas as a foundation for growth, balancing potential risks with robust market demand.
Smart Data Insight
Master the Perfect Entry & Exit for this Stock
Don't leave your profits to chance. Historically, this stock follows specific seasonal patterns that institutional traders use to maximize returns.
- ✅ Identify the "Golden Buying Window"
- ✅ Avoid high-risk correction cycles
- ✅ Backtested data from the last 20+ years