
July 24, 2026 a 02:46 am
STE: Dividend Analysis - STERIS plc
STERIS plc is a leading player in the healthcare sector with a stable dividend history. With a market capitalization near $20 billion, it presents a modest dividend yield. The company showcases consistent dividend payments over 22 years, establishing trust among investors. Such stability suggests STERIS values returning capital to shareholders alongside growth objectives.
📊 Overview
STERIS plc operates within the Healthcare sector, offering essential products and services. Its dividend yield is at 1.20%, and the current dividend payout per share stands at 2.46 USD. It proudly parades a 22-year history of continuous dividend payments, highlighting its commitment to rewarding investors. Notably, there have been no recent dividend cuts or suspensions, reflecting strong financial health and operational resilience.
| Detail | Value |
|---|---|
| Sector | Healthcare |
| Dividend yield | 1.20% |
| Current dividend per share | 2.46 USD |
| Dividend history | 22 years |
| Last cut or suspension | None |
📈 Dividend History
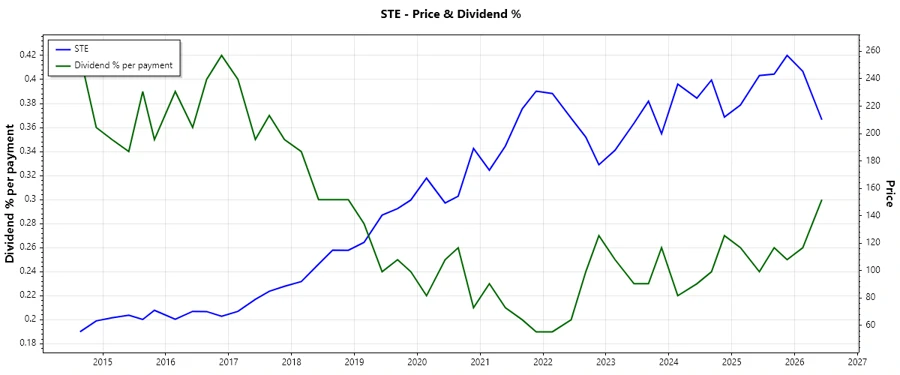
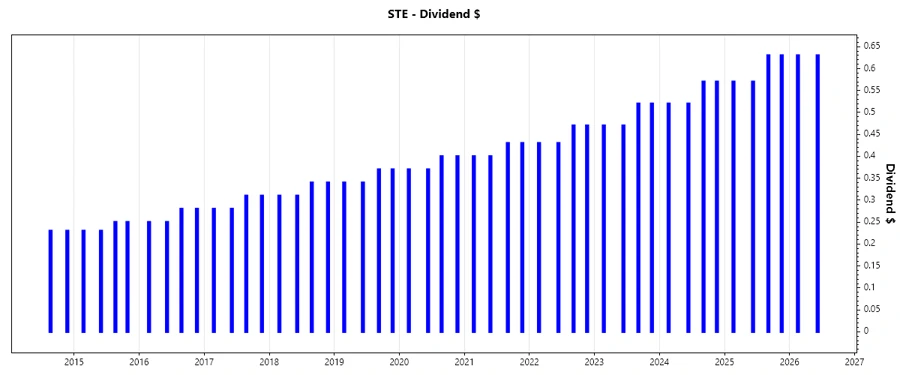
The progressive history in dividend payments underscores the firm’s stability and operational success. Investors prioritize companies with a prolonged track record as it indicates financial prudence and reliability. Below is a depiction of the last five dividend payments, affirming STERIS’s prudent financial management.
| Year | Dividend Per Share (USD) |
|---|---|
| 2026 | 1.26 |
| 2025 | 2.40 |
| 2024 | 2.18 |
| 2023 | 1.98 |
| 2022 | 1.80 |
📊 Dividend Growth
Consistent growth in dividends signals a company's ability to enhance shareholder returns. For STERIS, the dividend growth over the past three and five years indicates steady progress backed by robust financial performance. This growth reassures investors of the firm’s profitability and growth trajectory.
| Time | Growth |
|---|---|
| 3 years | 10.06% |
| 5 years | 9.28% |
The average dividend growth is 9.28% over 5 years. This shows moderate but steady dividend growth.
✅ Payout Ratio
Payout ratios offer insights into a firm’s ability to sustain dividends in the long run. A balanced payout ratio ensures that profits are adequately reinvested into the business while keeping investors contented. Below are the key payout ratios for STERIS.
| Key figure | Ratio |
|---|---|
| EPS-based | 30.84% |
| Free cash flow-based | 24.68% |
With an EPS-based payout ratio of 30.84% and a free cash flow-based payout of 24.68%, STERIS manifests prudent management of dividends, preserving enough earnings for growth and operational exigencies.
💡 Cashflow & Capital Efficiency
Analyzing cash flow and capital efficiency ratios is essential for understanding a company's operational performance and investment potential. Below are the critical metrics demonstrating STERIS’s fiscal robustness and capital allocation efficacy.
| Year | 2026 | 2025 | 2024 |
|---|---|---|---|
| Free Cash Flow Yield | 4.48% | 3.48% | 2.81% |
| Earnings Yield | 3.62% | 2.75% | 1.73% |
| CAPEX to Operating Cash Flow | 27.51% | 32.24% | 37.02% |
| Stock-based Compensation to Revenue | 1.58% | 1.05% | 1.10% |
| Free Cash Flow / Operating Cash Flow Ratio | 72.49% | 67.76% | 62.98% |
STERIS exhibits solid cash flow metrics, with a stable free cash flow yield and controlled CAPEX expenditures enhancing operational efficiency and future profitability.
📉 Balance Sheet & Leverage Analysis
The leverage and liquidity ratios offer a look into the company’s financial stability and risk profile. These ratios help investors assess the company's capacity to manage its debt and meet its obligations.
| Year | 2026 | 2025 | 2024 |
|---|---|---|---|
| Debt-to-Equity | 0.29 | 0.33 | 0.54 |
| Debt-to-Assets | 0.19 | 0.22 | 0.31 |
| Debt-to-Capital | 0.23 | 0.25 | 0.35 |
| Net Debt to EBITDA | 0.90 | 1.49 | 2.25 |
| Current Ratio | 2.09 | 1.96 | 3.08 |
| Quick Ratio | 1.54 | 1.39 | 2.36 |
| Financial Leverage | 1.49 | 1.54 | 1.76 |
The decreasing trend in leverage ratios suggests a strengthening balance sheet and improved financial flexibility, beneficial for future investments and dividend sustainability.
📈 Fundamental Strength & Profitability
Profitability ratios are pivotal in evaluating a company’s ability to generate profit relative to its expenses. Analyzing these metrics presents insights into operational efficiency and competitive positioning.
| Year | 2026 | 2025 | 2024 |
|---|---|---|---|
| Return on Equity | 10.93% | 9.31% | 6.00% |
| Return on Assets | 7.31% | 6.06% | 3.42% |
| Net Margin | 13.23% | 11.26% | 7.36% |
| EBIT Margin | 18.67% | 16.16% | 16.49% |
| EBITDA Margin | 26.86% | 24.88% | 27.49% |
| Gross Margin | 44.25% | 44.01% | 43.17% |
| R&D to Revenue | 1.90% | 1.97% | 2.02% |
STERIS’s margins and returns underscore its strong operational efficiency with competitive positioning, promising future profitability and continuous dividends.
Price Development
🗣️ Dividend Scoring System
| Criteria | Score | Score Bar |
|---|---|---|
| Dividend yield | 3 | |
| Dividend Stability | 5 | |
| Dividend growth | 4 | |
| Payout ratio | 4 | |
| Financial stability | 4 | |
| Dividend continuity | 5 | |
| Cashflow Coverage | 4 | |
| Balance Sheet Quality | 5 |
Total Score: 34/40
🌟 Rating
STERIS plc exhibits a commendable aptitude in maintaining and growing its dividend, backed by robust financial metrics and a significant focus on prudent capital management. Despite a lower dividend yield than industry norms, its payout stability and growth ensure STERIS is a reliable income-generating opportunity for risk-cognizant investors.
Smart Data Insight
Master the Perfect Entry & Exit for this Stock
Don't leave your profits to chance. Historically, this stock follows specific seasonal patterns that institutional traders use to maximize returns.
- ✅ Identify the "Golden Buying Window"
- ✅ Avoid high-risk correction cycles
- ✅ Backtested data from the last 20+ years