September 14, 2025 a 03:31 pm

STE: Dividend Analysis - STERIS plc
STERIS plc, a leader in the healthcare sector, has demonstrated a strong dividend history with consistent growth over the past 21 years. Despite a modest dividend yield, its growth potential stands out with steady increases. Investors should note its balanced payout ratios and solid financial health. The company's commitment to dividends shows a strong alignment with shareholder interests.
📊 Overview
STERIS plc has showcased a respectable performance in its sector, with a focus on providing reliable dividends over the years.
| Metric | Value |
|---|---|
| Sector | Healthcare |
| Dividend Yield | 0.96% |
| Current Dividend Per Share | $2.23 |
| Dividend History | 21 years |
| Last Cut or Suspension | None |
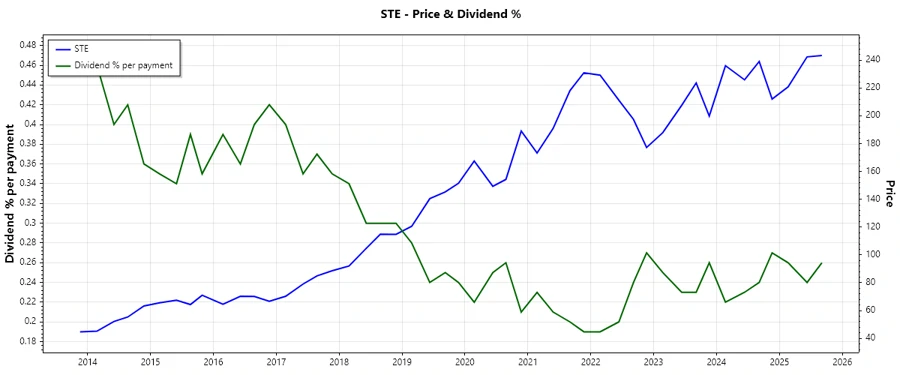
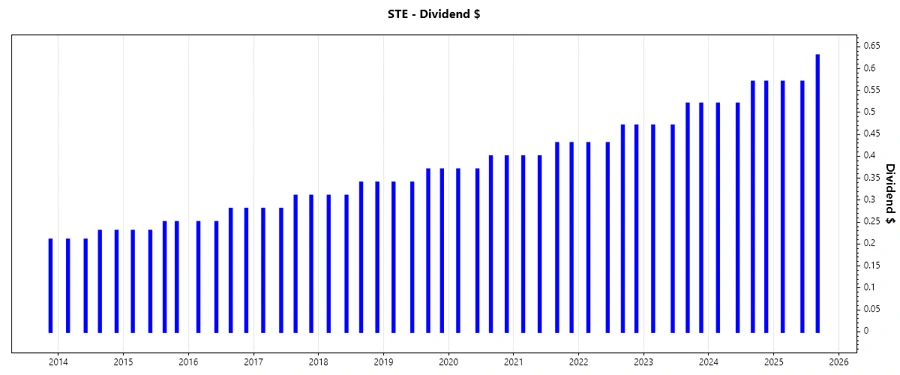
📉 Dividend History
The stability and growth of STERIS plc’s dividends are critical for investors seeking regular income. The lack of recent cuts or suspensions enhances its attractiveness.
| Year | Dividend Per Share (USD) |
|---|---|
| 2025 | $1.77 |
| 2024 | $2.18 |
| 2023 | $1.98 |
| 2022 | $1.80 |
| 2021 | $1.66 |
📈 Dividend Growth
Analyzing the growth trajectory of dividends reveals STERIS plc's commitment to enhancing shareholder value. A consistent dividend increase can signal financial robustness and future potential.
| Time | Growth |
|---|---|
| 3 years | 9.51% |
| 5 years | 8.95% |
✅ The average dividend growth is 8.95% over 5 years. This shows moderate but steady dividend growth.
🗣️ Payout Ratio
A crucial metric in dividend analysis, the payout ratio helps assess the sustainability of dividends. Low ratios generally indicate room for future increases.
| Key Figure | Ratio |
|---|---|
| EPS-based | 33.94% |
| Free cash flow-based | 24.17% |
✅ The EPS-based payout ratio of 33.94% and FCF-based ratio of 24.17% indicate a well-maintained balance between rewarding shareholders and ensuring growth.
💰 Cashflow & Capital Efficiency
Assessing cash flow and capital efficiency is fundamental in understanding a company's financial health and its ability to sustain and grow dividends.
| Metric | 2023 | 2024 | 2025 |
|---|---|---|---|
| Free Cash Flow Yield | 2.07% | 2.81% | 3.48% |
| Earnings Yield | 0.56% | 1.73% | 2.75% |
| CAPEX to Operating Cash Flow | 47.82% | 37.02% | 32.24% |
| Stock-based Compensation to Revenue | 0.86% | 1.10% | 1.05% |
| Free Cash Flow / Operating Cash Flow Ratio | 52.18% | 62.98% | 67.76% |
While capital efficiency has improved over the years, the company's ability to generate substantial free cash flow relative to its operating cash flow is a positive indicator.
📈 Balance Sheet & Leverage Analysis
Understanding leverage and balance sheet health provides insight into a company's risk profile and its ability to cover obligations.
| Metric | 2023 | 2024 | 2025 |
|---|---|---|---|
| Debt-to-Equity | 0.53 | 0.54 | 0.33 |
| Debt-to-Assets | 0.30 | 0.31 | 0.22 |
| Debt-to-Capital | 0.35 | 0.35 | 0.25 |
| Net Debt to EBITDA | 2.26 | 2.25 | 1.49 |
| Current Ratio | 2.33 | 3.08 | 1.96 |
| Quick Ratio | 1.63 | 2.36 | 1.39 |
| Financial Leverage | 1.78 | 1.76 | 1.54 |
STERIS's declining leverage ratios and solid current ratios reflect enhanced financial stability, preparing it well for future growth initiatives.
🔍 Fundamental Strength & Profitability
Profitability metrics provide insight into the company's ability to generate earnings and maintain operational efficiency.
| Metric | 2023 | 2024 | 2025 |
|---|---|---|---|
| Return on Equity | 1.76% | 6.00% | 9.31% |
| Return on Assets | 0.99% | 3.42% | 6.06% |
| Net Margin | 2.36% | 7.36% | 11.26% |
| EBIT Margin | 17.44% | 16.49% | 16.16% |
| EBITDA Margin | 29.63% | 27.49% | 24.89% |
| Gross Margin | 43.66% | 43.17% | 44.01% |
Consistent improvements in return metrics highlight STERIS plc's strategic focus towards efficiency and sustainable profitability.
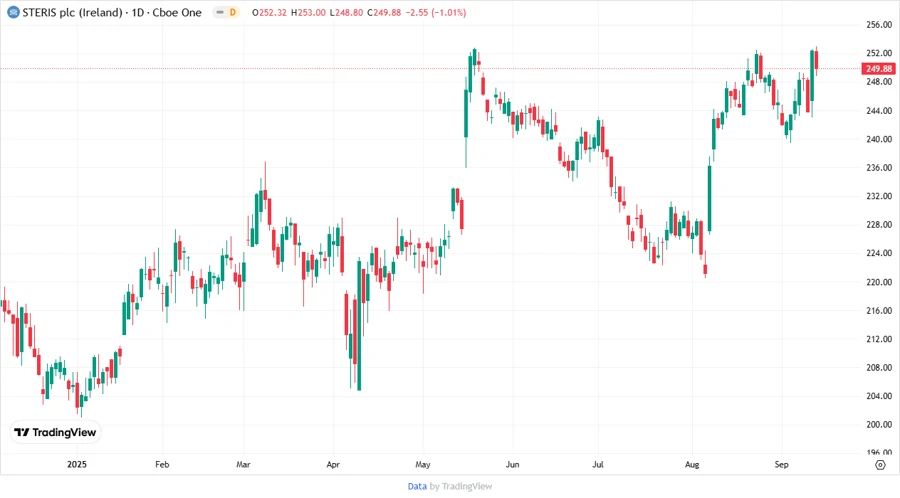
📈 Price Development
🌟 Dividend Scoring System
| Criterion | Score | Bar |
|---|---|---|
| Dividend Yield | 3 | |
| Dividend Stability | 5 | |
| Dividend Growth | 4 | |
| Payout Ratio | 4 | |
| Financial Stability | 5 | |
| Dividend Continuity | 5 | |
| Cashflow Coverage | 4 | |
| Balance Sheet Quality | 5 |
Overall Score: 35/40
🗣️ Rating
STERIS plc receives a robust rating based on its stable and growing dividends, sound financial health, and strong commitment to shareholder returns. It stands as a compelling choice for long-term investors seeking consistent dividend returns and financial stability.
Smart Data Insight
Master the Perfect Entry & Exit for this Stock
Don't leave your profits to chance. Historically, this stock follows specific seasonal patterns that institutional traders use to maximize returns.
- ✅ Identify the "Golden Buying Window"
- ✅ Avoid high-risk correction cycles
- ✅ Backtested data from the last 20+ years