June 11, 2025 a 12:46 pm


STE: Dividend Analysis - STERIS plc
STERIS plc exhibits a consistent dividend profile, with a history of 21 years of stable payments. The company's current yield of 0.94% is modest, reflecting its focus on growth and reinvestment. With a track record of increasing dividends, investors can anticipate a continuation of this trend, supported by strong fundamentals and a manageable payout ratio.
📊 Overview
STERIS plc is a robust player in its sector, recognized for its commitment to shareholder returns through dividends. The firm's dividend yield of 0.94% might appear modest, yet it reflects a strategic approach of sustainable payouts aligned with growth opportunities.
| Metric | Value |
|---|---|
| Sector | Healthcare Equipment |
| Dividend Yield | 0.94% |
| Current Dividend per Share | 2.23 USD |
| Dividend History | 21 years |
| Last Cut or Suspension | None |
🗣️ Dividend History
The dividend history of STERIS plc underscores its reliability and commitment to shareholders. Over the past 21 years, the company has consistently rewarded investors, reinforcing their confidence in its operational stability and fiscal policies. Such a record is pivotal for long-term investment strategies, ensuring steady income amidst market fluctuations.
| Year | Dividend per Share (USD) |
|---|---|
| 2025 | 1.14 |
| 2024 | 2.18 |
| 2023 | 1.98 |
| 2022 | 1.80 |
| 2021 | 1.66 |
📈 Dividend Growth
The dividend growth rate of STERIS plc indicates a commendable trend over the past few years, showcasing the company’s ability to increase shareholder returns. This growth can boost investor confidence, highlighting the firm’s potential for future expansion and dividend enhancement.
| Time | Growth |
|---|---|
| 3 years | 9.51% |
| 5 years | 8.95% |
The average dividend growth is 8.95% over 5 years. This shows moderate but steady dividend growth.
✅ Payout Ratio
The payout ratios are pivotal in assessing the sustainability of STERIS plc's dividends. With an EPS-based payout ratio of approximately 35.66% and a free cash flow-based ratio of 28.12%, the company maintains a balanced approach to return earnings to shareholders while investing in business operations.
| Key Figure | Ratio |
|---|---|
| EPS-based | 35.66% |
| Free cash flow-based | 28.12% |
The EPS payout ratio indicates a cautious approach to dividends, ensuring stability and future profitability, while the FCF ratio reflects sound cash management, supporting consistent dividend payouts.
🌟 Cashflow & Capital Efficiency
Understanding cash flow dynamics and capital efficiency is crucial for evaluating the financial health of STERIS plc. By examining metrics such as free cash flow yield and capex ratios, stakeholders can assess operational effectiveness and strategic investments.
| Metric | 2023 | 2024 | 2025 |
|---|---|---|---|
| Free Cash Flow Yield | 2.07% | 2.81% | 3.48% |
| Earnings Yield | 0.56% | 1.73% | 2.75% |
| CAPEX to Operating Cash Flow | 47.82% | 37.02% | 32.17% |
| Stock-based Compensation to Revenue | 0.86% | 1.10% | 0.87% |
| Free Cash Flow / Operating Cash Flow Ratio | 52.18% | 62.98% | 67.76% |
The cashflow metrics reveal prudent financial management, with a solid free cash flow indicating strong potential for reinvestment and shareholder returns, while maintaining liquidity for future opportunities.
⚖️ Balance Sheet & Leverage Analysis
Analysis of the balance sheet and leverage ratios provides insight into STERIS plc's financial position, emphasizing its capacity to meet obligations and leverage for growth. Such metrics are critical for risk assessment and financial strategy formulation.
| Metric | 2023 | 2024 | 2025 |
|---|---|---|---|
| Debt-to-Equity | 0.53 | 0.54 | 0.31 |
| Debt-to-Assets | 0.30 | 0.31 | 0.20 |
| Debt-to-Capital | 0.35 | 0.35 | 0.24 |
| Net Debt to EBITDA | 2.27 | 2.25 | 2.16 |
| Current Ratio | 2.33 | 3.08 | 1.96 |
| Quick Ratio | 1.53 | 2.36 | 1.39 |
| Financial Leverage | 1.78 | 1.76 | 1.53 |
The balance sheet ratios indicate strong financial leverage, with effective debt management strategies improving liquidity and lowering leverage over time.
🏆 Fundamental Strength & Profitability
Evaluating the fundamental strengths focuses on profitability ratios that reflect STERIS plc's capacity to generate value from its investments. These metrics underpin strategic decision-making and performance projections.
| Metric | 2023 | 2024 | 2025 |
|---|---|---|---|
| Return on Equity | 1.76% | 6.00% | 9.29% |
| Return on Assets | 0.99% | 3.42% | 6.06% |
| Margins (Net) | 2.36% | 7.36% | 11.26% |
| Margins (EBIT) | 17.44% | 16.49% | 16.16% |
| Margins (EBITDA) | 29.56% | 27.49% | 15.87% |
| Margins (Gross) | 43.66% | 43.52% | 44.01% |
| Research & Development to Revenue | 2.17% | 2.02% | 1.97% |
The fundamental strength of STERIS plc is evident in its robust margins and efficient asset utilization, confirming its ability to maintain competitive positioning and return on equity.
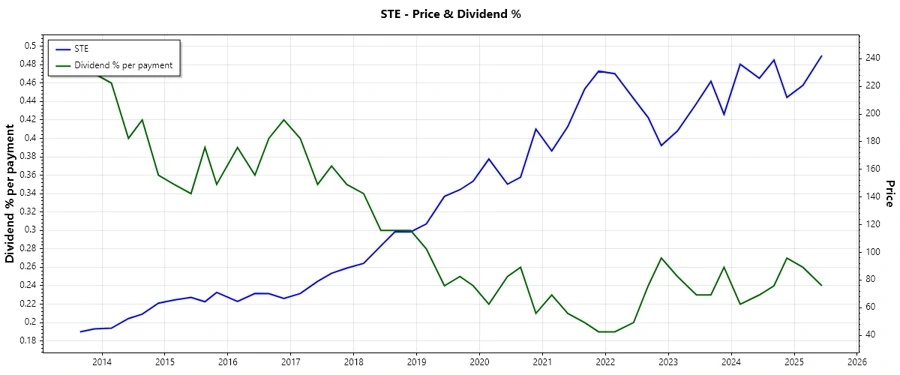
👀 Price Development
🔍 Dividend Scoring System
| Criteria | Score | Indicator |
|---|---|---|
| Dividend Yield | 2 | |
| Dividend Stability | 5 | |
| Dividend Growth | 4 | |
| Payout Ratio | 4 | |
| Financial Stability | 4 | |
| Dividend Continuity | 5 | |
| Cashflow Coverage | 3 | |
| Balance Sheet Quality | 4 |
Overall Score: 31/40
⚠️ Rating
Based on the detailed analysis, STERIS plc is rated as a solid dividend stock with reliable payout history and promising growth potential. Investors seeking a combination of stability and moderate yield will find this investment appealing, supported by its robust financial metrics and consistent dividend performance.
Smart Data Insight
Master the Perfect Entry & Exit for this Stock
Don't leave your profits to chance. Historically, this stock follows specific seasonal patterns that institutional traders use to maximize returns.
- ✅ Identify the "Golden Buying Window"
- ✅ Avoid high-risk correction cycles
- ✅ Backtested data from the last 20+ years