October 21, 2025 a 02:03 pm
SRE: Trend and Support & Resistance Analysis - Sempra
Sempra operates in the energy services sector, providing critical electric and natural gas services across the US and internationally. Recently, the stock has exhibited fluctuating trends, reflecting market conditions and sector dynamics. Understanding the stock movement in line with technical indicators can offer insights into future prospects. A comprehensive analysis of the EMAs and support/resistance levels helps investors anticipate potential shifts. By observing the trend patterns, one can make informed decisions aligned with market movement.
Trend Analysis
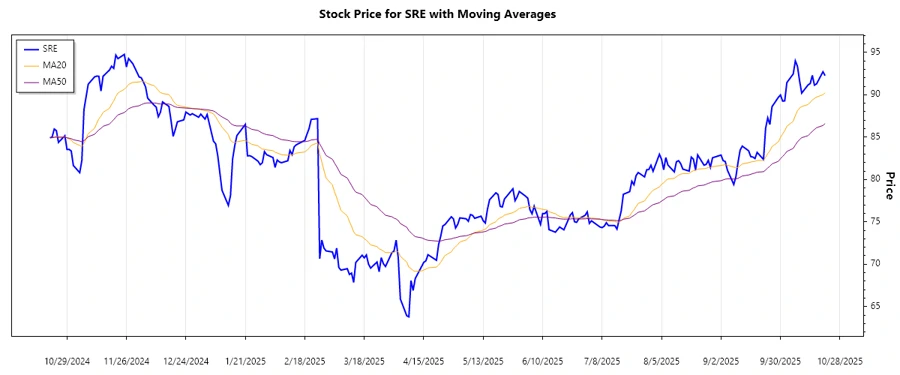
The analysis of the Sempra stock over the past months depicts a dynamic trend with recent fluctuations in closing prices. Calculating the EMA20 and EMA50 indicates:
- If EMA20 > EMA50: ▲ Uptrend
- If EMA20 < EMA50: ▼ Downtrend
- If EMA20 ≈ EMA50: ⚖️ Sideway trend
| Date | Closing Price | Trend |
|---|---|---|
| 2025-10-21 | 92.26 | ▼ |
| 2025-10-20 | 92.72 | ▼ |
| 2025-10-17 | 91.29 | ▼ |
| 2025-10-16 | 91.14 | ▼ |
| 2025-10-15 | 92.29 | ▲ |
| 2025-10-14 | 91.33 | ▲ |
| 2025-10-13 | 91.17 | ▲ |
The current technical trend based on EMA analysis indicates a short-term downtrend transitioning into a possible stabilizing phase. Investors should watch for any further convergence between the EMA20 and EMA50 to anticipate a possible reversal.
Support and Resistance
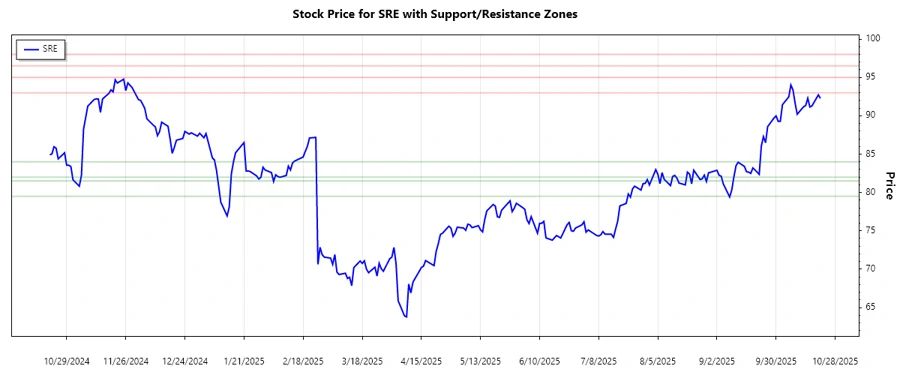
Based on the closing prices, the following support and resistance zones have been calculated:
| Zone Type | From | To |
|---|---|---|
| Support | 79.50 | 81.50 |
| Support | 82.00 | 84.00 |
| Resistance | 93.00 | 95.00 |
| Resistance | 96.50 | 98.00 |
The current stock price of 92.26 is near the high of a support zone, indicating potential stability before a possible upward test of resistance levels. Observing price movements in these zones can provide insight into market sentiment and expected price action.
Conclusion
The technical analysis of Sempra's stock reveals a complex interplay of short-term downtrends with potential stabilization. The presence of defined support and resistance zones indicates areas where price action may consolidate or reverse. Investors should consider both technical indicators and market conditions when evaluating investment opportunities. While the stock has potential for upward movement if it breaks resistance zones, it is also vulnerable to downtrends if it falls below support levels. Therefore, close monitoring is essential for making informed decisions.
Smart Data Insight
Master the Perfect Entry & Exit for this Stock
Don't leave your profits to chance. Historically, this stock follows specific seasonal patterns that institutional traders use to maximize returns.
- ✅ Identify the "Golden Buying Window"
- ✅ Avoid high-risk correction cycles
- ✅ Backtested data from the last 20+ years