September 18, 2025 a 11:45 am
SRE: Fibonacci Analysis - Sempra
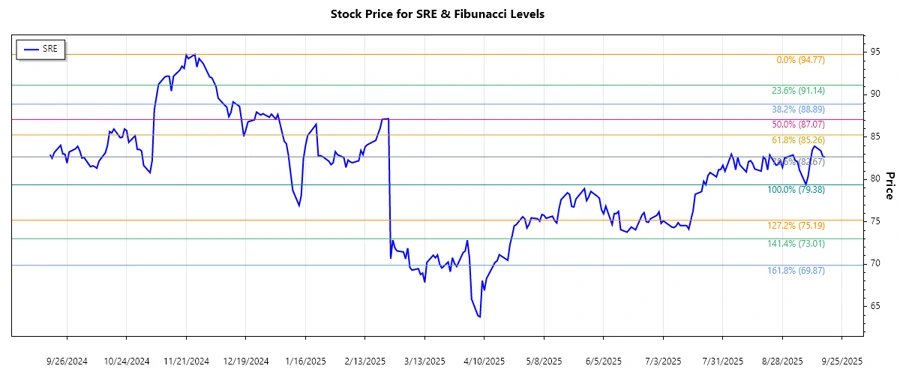
The Sempra stock, ticker SRE, has shown a consistent downward trend over the past months indicating potential investor apprehension. Recently, however, there are signs of stabilization, suggesting possible opportunities for a rebound. Given the company's strong foundation in energy services, analysts are closely watching for any fundamental shifts that might influence future trajectories.
Fibonacci Analysis
| Parameter | Details | ||||||||||||
|---|---|---|---|---|---|---|---|---|---|---|---|---|---|
| Start Date | 2024-11-24 | ||||||||||||
| End Date | 2025-09-17 | ||||||||||||
| High Point (Date/Price) | 2024-11-24 / 94.77 | ||||||||||||
| Low Point (Date/Price) | 2025-09-09 / 79.38 | ||||||||||||
| Fibonacci Levels |
|
||||||||||||
| Current Price | 82.65 | ||||||||||||
| Retracement Zone | 0.236 | ||||||||||||
| Interpretation | Currently positioned within the 0.236 retracement zone, indicating a potential support level. |
Conclusion
Sempra's stock has experienced a setback, primarily due to market uncertainties and sector-specific challenges. However, the current positioning within the 0.236 Fibonacci level might suggest potential stabilizing forces at play. For investors, this presents both opportunities and risks. While the downside risks remain due to macroeconomic factors, the company's fundamental strength may provide a safety cushion. Analysts recommend close monitoring of energy sector developments and company-specific news for informed decision-making.
Smart Data Insight
Master the Perfect Entry & Exit for this Stock
Don't leave your profits to chance. Historically, this stock follows specific seasonal patterns that institutional traders use to maximize returns.
- ✅ Identify the "Golden Buying Window"
- ✅ Avoid high-risk correction cycles
- ✅ Backtested data from the last 20+ years