June 01, 2026 a 07:46 am


SRE: Dividend Analysis - Sempra
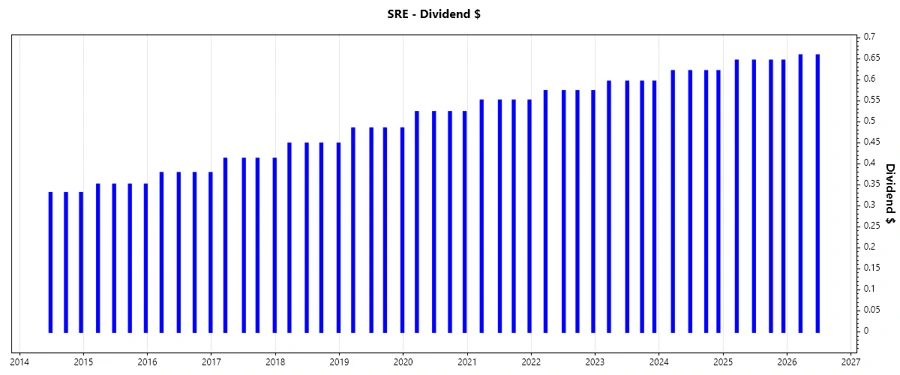
Sempra has established a strong track record of dividend payments, evident in its consistent increase over the years. With over four decades of dividend history and a yield approaching 3%, it presents a viable investment option for income-seeking investors. However, factors such as payout ratios and cash flow dynamics demand closer scrutiny.
📊 Overview
Understanding Sempra's dividend yield within its sector is paramount for gauging its competitiveness and sustainability. Its yield is 2.92%, supported by a per-share dividend of $2.52. With a 43-year history of dividend issuance and no recent cuts, Sempra exhibits commendable stability.
| Category | Details |
|---|---|
| Sector | Energy |
| Dividend yield | 2.92 % |
| Current dividend per share | 2.52 USD |
| Dividend history | 43 years |
| Last cut or suspension | None |
🗣️ Dividend History
Sempra's ability to uphold a steady dividend payment over 43 years stands as a testament to its solid business model and cash flow management. These historical payouts enhance investor confidence, indicating a reliable income source.
| Year | Dividend per Share (USD) |
|---|---|
| 2026 | 1.315 |
| 2025 | 2.580 |
| 2024 | 2.480 |
| 2023 | 2.380 |
| 2022 | 2.290 |
📈 Dividend Growth
The three and five-year growth rates of 4.05% and 4.30% respectively highlight Sempra's steady inclination toward rewarding shareholders. Such growth is vital for offsetting inflation, thereby maintaining the real value of dividend income.
| Time | Growth |
|---|---|
| 3 years | 4.05 % |
| 5 years | 4.30 % |
The average dividend growth is 4.30% over 5 years. This shows moderate but steady dividend growth.
📉 Payout Ratio
The payout ratio, derived from earnings (79.48%) and free cash flow (-28.15%), gauges dividend safety. While the EPS-based figure is moderately high, indicating reasonable confidence, the negative FCF-based ratio denotes volatility and potential reinvestment gaps.
| Key figure | Ratio |
|---|---|
| EPS-based | 79.48 % |
| Free cash flow-based | -28.15 % |
The 79.48% EPS payout is marginally acceptable, but the negative FCF payout raises concerns about cash flow sufficiency for dividend coverage.
✅ Cashflow & Capital Efficiency
Robust cash flows are pivotal for sustaining dividends, but Sempra's metrics depict a negative cash flow yield with a high CAPEX-to-operating cash flow ratio. While earnings yield is positive, the negative free cash flow raises liquidity concerns.
| Year | 2023 | 2024 | 2025 |
|---|---|---|---|
| Free Cash Flow Yield | -4.63% | -5.95% | -10.49% |
| Earnings Yield | 6.53% | 5.15% | 3.19% |
| CAPEX to Operating Cash Flow | 135.04% | 167.41% | 232.46% |
| Stock-based Compensation to Revenue | 0.51% | 0.66% | 0.28% |
| Free Cash Flow / Operating Cash Flow Ratio | -35.04% | -67.41% | -132.46% |
| Return on Invested Capital | 3.36% | 2.94% | 2.56% |
Despite decent earnings yields, the negative FCF and high CAPEX constraints reflect on operational efficiency and capital use, questioning liquidity adequacy.
⚠️ Balance Sheet & Leverage Analysis
Understanding leverage ratios such as debt-to-equity and current ratios spotlights financial maneuverability, while Sempra's net debt to EBITDA conveys a hefty debt burden, urging careful credit risk assessment.
| Year | 2023 | 2024 | 2025 |
|---|---|---|---|
| Debt-to-Equity | 1.08 | 1.15 | 1.15 |
| Debt-to-Assets | 35.65% | 37.28% | 32.73% |
| Debt-to-Capital | 51.99% | 53.43% | 53.44% |
| Net Debt to EBITDA | 5.04 | 5.86 | 5.28 |
| Current Ratio | 0.54 | 0.55 | 1.59 |
| Quick Ratio | 0.49 | 0.49 | 1.57 |
| Financial Leverage | 3.04 | 3.08 | 3.51 |
With a notable debt load evidenced by high debt-to-capital and net debt to EBITDA ratios, financial flexibility appears constrained.
🗣️ Fundamental Strength & Profitability
Examining profitability through margins and returns gauges the quality of earnings and firm efficiency. Sempra's margins reflect substantial profits, yet R&D expenses seem negligible, bypassing innovation insights.
| Year | 2023 | 2024 | 2025 |
|---|---|---|---|
| Return on Equity | 10.72% | 9.16% | 5.81% |
| Return on Assets | 3.53% | 2.98% | 1.66% |
| Net Margin | 19.46% | 22.09% | 13.40% |
| EBIT Margin | 24.61% | 26.34% | 31.40% |
| EBITDA Margin | 38.70% | 45.15% | 50.09% |
| Gross Margin | 23.71% | 27.20% | 29.15% |
| Research & Development to Revenue | 0% | 0% | 0% |
Sempra maintains strong margins, enhancing profitability metrics. However, lack of R&D allocations may limit growth avenues or innovation potential.
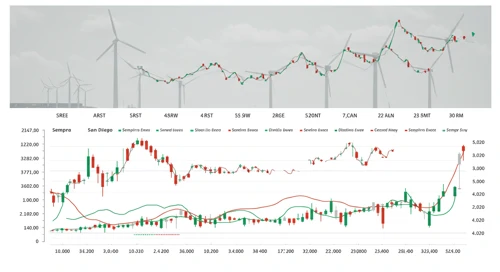
📈 Price Development
Dividend Scoring System (H2)
A comprehensive scoring system evaluates Sempra's dividend profile across multiple dimensions, encouraging balanced investment decisions.
| Criteria | Score (out of 5) | Score Bar |
|---|---|---|
| Dividend Yield | 3 | |
| Dividend Stability | 5 | |
| Dividend Growth | 3 | |
| Payout Ratio | 2 | |
| Financial Stability | 3 | |
| Dividend Continuity | 5 | |
| Cashflow Coverage | 2 | |
| Balance Sheet Quality | 3 |
Total Score: 26/40
⚠️ Rating
Sempra demonstrates a reliable and attractive dividend tenure, crucial for income-fixated investors. Nonetheless, the fluidity in cash flow coverage and substantial payout ratio warrants consideration. Overall, Sempra merits a cautious "Hold" rating based on balanced risk and income prospects.
Smart Data Insight
Master the Perfect Entry & Exit for this Stock
Don't leave your profits to chance. Historically, this stock follows specific seasonal patterns that institutional traders use to maximize returns.
- ✅ Identify the "Golden Buying Window"
- ✅ Avoid high-risk correction cycles
- ✅ Backtested data from the last 20+ years