March 24, 2026 a 11:31 am
SRE: Dividend Analysis - Sempra
Sempra has a strong footing in the utilities sector with a remarkable track record of 43 years of uninterrupted dividend payments. Its current dividend yield stands at 2.72%, enhancing its appeal to income-focused investors. Notably, the company has no history of recent dividend cuts or suspensions, reinforcing its commitment to shareholder returns.
📊 Overview
Sempra operates within the robust utilities sector, benefiting from stable demand. The company's dividend yield of 2.72% may not be the highest, but the reliability and consistency of its payouts - sustained over 43 years - underscore its strength in dividend continuity. Moreover, there have been no recent cuts or suspensions, which highlights resilient revenue streams.
| Details | Value |
|---|---|
| Sector | Utilities |
| Dividend Yield | 2.72% |
| Current Dividend Per Share | $2.52 USD |
| Dividend History | 43 years |
| Last Cut or Suspension | None |
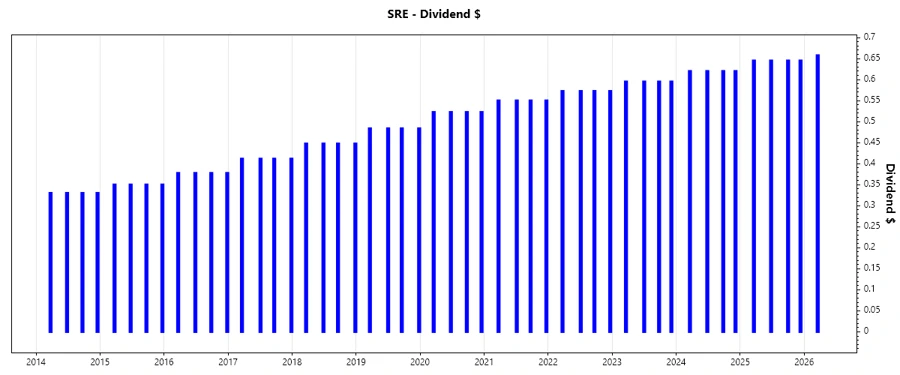
🗣️ Dividend History
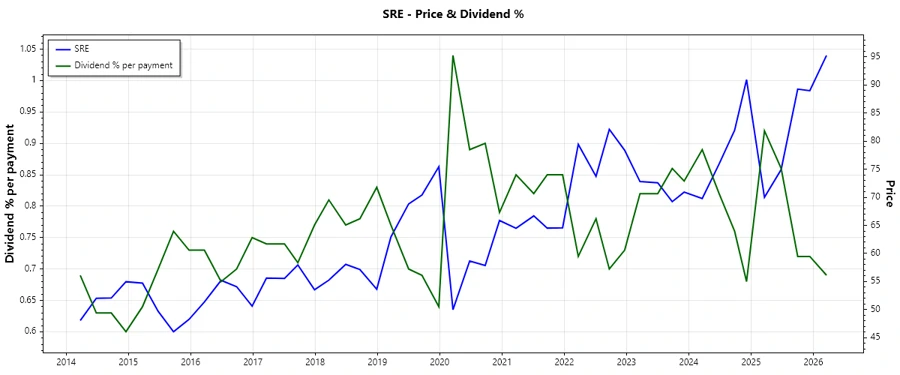
The dividend history of Sempra showcases an uninterrupted growth trajectory over four decades, providing a dependable income source to its investors. Such historical performance is crucial in assessing long-term investments, particularly for those prioritizing income stability and modest capital appreciation.
| Year | Dividend Per Share (USD) |
|---|---|
| 2026 | 0.6575 |
| 2025 | 2.5800 |
| 2024 | 2.4800 |
| 2023 | 2.3800 |
| 2022 | 2.2900 |
📈 Dividend Growth
Analyzing the dividend growth potential is essential for assessing future cash flows. Over the past three years, Sempra's dividend growth was 4.05%, and over five years, it averaged at 4.30%. This steady growth trajectory ensures adequate inflation protection and wealth accumulation over time.
| Time | Growth |
|---|---|
| 3 years | 4.05% |
| 5 years | 4.30% |
The average dividend growth is 4.30% over 5 years. This shows moderate but steady dividend growth.
✅ Payout Ratio
The payout ratio is a critical indicator of dividend sustainability. Sempra's current EPS-based payout ratio stands at 89.50%, indicating a substantial portion of earnings is distributed as dividends. The negative FCF-based payout ratio suggests current cash flows are insufficient without additional financing. It's essential for long-term dividend stability that the EPS payout remains manageable.
| Key Figure | Ratio |
|---|---|
| EPS-based | 89.50% |
| Free Cash Flow-based | -27.19% |
The high EPS payout indicates reliance on earnings for dividend coverage, while the negative FCF-based ratio points to potential vulnerability if earnings fluctuate.
⚠️ Cashflow & Capital Efficiency
Efficient capital allocation and robust cash flow are vital for sustaining dividends during economic downturns. While Sempra's financials depict a negative Free Cash Flow Yield, its Earnings Yield remains modest, reflecting earnings' adequacy but indicating potential cash flow challenges.
| Key Metric | 2025 | 2024 | 2023 |
|---|---|---|---|
| Free Cash Flow Yield | -10.49% | -5.95% | -4.63% |
| Earnings Yield | 3.19% | 5.15% | 6.53% |
| CAPEX to Operating Cash Flow | 232.46% | 167.41% | 135.04% |
| Stock-based Compensation to Revenue | 0% | 0.66% | 0.51% |
| Free Cash Flow / Operating Cash Flow Ratio | -132.46% | -67.41% | -35.04% |
The results indicate potential efficiency improvements are needed in capital deployment to align future cash flow with operational expenses.
📉 Balance Sheet & Leverage Analysis
The balance sheet analysis reveals leverage levels and liquidity positions, which are pivotal during economic uncertainties. Sempra's leverage ratios, with Debt-to-Equity at 1.15 and Debt-to-Assets at 32.73%, suggest moderate leverage, while the quick and current ratios signal cautious liquidity management.
| Key Metric | 2025 | 2024 | 2023 |
|---|---|---|---|
| Debt-to-Equity | 1.15 | 1.15 | 1.08 |
| Debt-to-Assets | 32.73% | 37.28% | 35.65% |
| Debt-to-Capital | 53.44% | 53.43% | 51.99% |
| Net Debt to EBITDA | 5.96 | 5.86 | 5.04 |
| Current Ratio | 1.59 | 0.55 | 0.54 |
| Quick Ratio | 1.57 | 0.49 | 0.49 |
| Financial Leverage | 3.51 | 3.08 | 3.04 |
While leverage is manageable, enhancements in liquidity might prudent for cushioning against potential market disruptions or sudden demand changes.
Fundamental Strength & Profitability
Profitability metrics like Return on Equity (RoE) and Return on Assets (RoA) are vital measures of operational efficiency and effectiveness. Sempra maintains moderate profitability, with RoE improving progressively, indicating enhanced shareholder returns.
| Key Metric | 2025 | 2024 | 2023 |
|---|---|---|---|
| Return on Equity | 5.81% | 9.16% | 10.72% |
| Return on Assets | 1.66% | 2.98% | 3.53% |
| Margins: Net | 13.40% | 22.08% | 19.46% |
| Margins: EBIT | 31.40% | 26.34% | 24.61% |
| Margins: EBITDA | 50.09% | 45.15% | 38.70% |
| Margins: Gross | 29.15% | 27.20% | 23.71% |
| Research & Development to Revenue | 0% | 0% | 0% |
The consistent improvement in RoE and expanding profit margins are indicative of inherent operational robustness and proficient management execution.
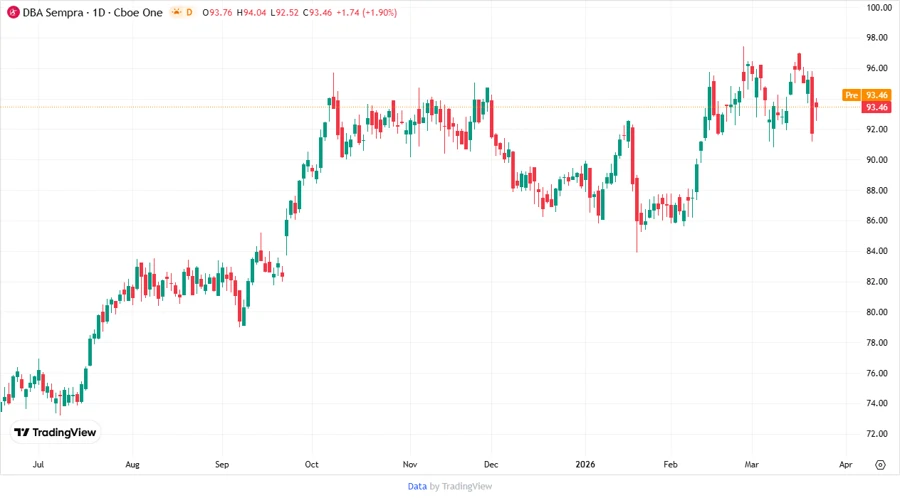
📊 Price Development
Dividend Scoring System
| Criteria | Score (out of 5) | Visualization |
|---|---|---|
| Dividend Yield | 3 | |
| Dividend Stability | 5 | |
| Dividend Growth | 3 | |
| Payout Ratio | 2 | |
| Financial Stability | 4 | |
| Dividend Continuity | 5 | |
| Cashflow Coverage | 2 | |
| Balance Sheet Quality | 3 |
Overall Score: 27/40
Rating
Sempra exhibits a formidable dividend history with commendable stability and continuity. While earnings and cash flows pose consideration for future dividend growth, the present yield and strong historical performance make it a viable consideration for conservative portfolios seeking reliable income. Continuous focus on operational efficiencies and balance sheet optimization can further enhance shareholder value.
Smart Data Insight
Master the Perfect Entry & Exit for this Stock
Don't leave your profits to chance. Historically, this stock follows specific seasonal patterns that institutional traders use to maximize returns.
- ✅ Identify the "Golden Buying Window"
- ✅ Avoid high-risk correction cycles
- ✅ Backtested data from the last 20+ years