March 20, 2026 a 12:47 pm
SRE: Dividend Analysis - Sempra
Sempra offers a robust dividend profile with a satisfactory dividend yield and a long history of dividend payments. The company's commitment to staying ahead in the energy sector is reflected in its consistent dividend growth over many decades. While the payout ratio is high, reflecting a potentially aggressive dividend policy, it signifies Sempra's trust in its future earnings stability.
📊 Overview
The overview section provides a concise glimpse into Sempra's sector and dividend metrics that help gauge its investment viability.
| Criteria | Details |
|---|---|
| Sector | Utilities |
| Dividend yield | 2.72 % |
| Current dividend per share | 2.52 USD |
| Dividend history | 43 years |
| Last cut or suspension | None |
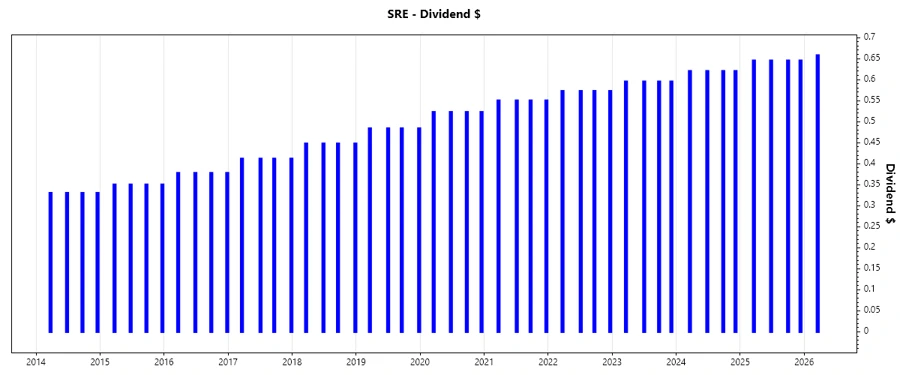
📈 Dividend History
Sempra's long-standing commitment to its shareholders is evidenced by its 43-year dividend payment streak. This is a testament to the company's stable cash flows and strong financial footing.
| Year | Dividend per Share (USD) |
|---|---|
| 2026 | 0.6575 |
| 2025 | 2.580 |
| 2024 | 2.48 |
| 2023 | 2.380 |
| 2022 | 2.290 |
📊 Dividend Growth
The analysis of dividend growth over the past three to five years serves as an indicator of Sempra's commitment to shareholder returns. The growth metrics are crucial for investors relying on increasing income through dividends.
| Time | Growth |
|---|---|
| 3 years | 0.04 % |
| 5 years | 0.04 % |
The average dividend growth is 4.3% over 5 years. This shows moderate but steady dividend growth.
✅ Payout Ratio
The payout ratio is a critical measure indicating how much of Sempra's earnings are paid out as dividends. Understanding these ratios is fundamental to evaluating the sustainability of the dividend payments.
| Key figure | Ratio |
|---|---|
| EPS-based | 89.50 % |
| Free cash flow-based | -27.19 % |
The high EPS-based payout ratio suggests that a large portion of earnings is dedicated to dividends, imposing pressure if earnings falter. The negative FCF ratio indicates concerning cash generation issues.
📈 Cashflow & Capital Efficiency
Cashflows and capital efficiency measures enable a deeper inspection of how efficiently Sempra translates its earnings into operational results, financial health, and long-term growth potential.
| Year | 2023 | 2024 | 2025 |
|---|---|---|---|
| Free Cash Flow Yield | -4.62 % | -5.95 % | -10.49 % |
| Earnings Yield | 6.53 % | 5.15 % | 3.19 % |
| CAPEX to Operating Cash Flow | 1.35 | 1.67 | 2.32 |
| Stock-based Compensation to Revenue | 0.51 % | 0.66 % | 0 |
| Free Cash Flow / Operating Cash Flow Ratio | -0.35 | -0.67 | -1.32 |
The cash flow figures point to inefficiencies and potential liquidity stresses. Strategic management improvements are necessary for enhancing cash generation stability.
⚠️ Balance Sheet & Leverage Analysis
Sempra's balance sheet analysis sheds light on its leverage and liquidity spectrum – essential to determine risk exposure and financial flexibility.
| Year | 2023 | 2024 | 2025 |
|---|---|---|---|
| Debt-to-Equity | 1.08 | 1.15 | 1.14 |
| Debt-to-Assets | 0.36 | 0.37 | 0.33 |
| Debt-to-Capital | 0.52 | 0.53 | 0.53 |
| Net Debt to EBITDA | 5.04 | 5.86 | 5.96 |
| Current Ratio | 0.54 | 0.55 | 1.59 |
| Quick Ratio | 0.49 | 0.49 | 1.57 |
| Financial Leverage | 3.04 | 3.08 | 3.51 |
The leverage metrics indicate high debt levels, which could stress Sempra's financial structure. While current ratio levels have improved, liquidity management remains crucial amidst high financial leverage.
📉 Fundamental Strength & Profitability
Evaluating fundamental strength indicates Sempra's profitability and operational efficiency, providing insights into its ability to sustain growth and endure economic cycles.
| Year | 2023 | 2024 | 2025 |
|---|---|---|---|
| Return on Equity | 10.72 % | 9.16 % | 5.81 % |
| Return on Assets | 3.53 % | 2.98 % | 1.66 % |
| Margins: Net | 19.46 % | 22.09 % | 13.40 % |
| Margins: EBIT | 24.61 % | 26.34 % | 31.40 % |
| Margins: EBITDA | 38.70 % | 45.15 % | 50.09 % |
| Margins: Gross | 23.71 % | 27.20 % | 29.15 % |
| Research & Development to Revenue | 0 | 0 | 0 |
The profit margins illustrate robust operational performance, yet the decreasing return on equity year-on-year may warrant strategic updates to improve value creation.
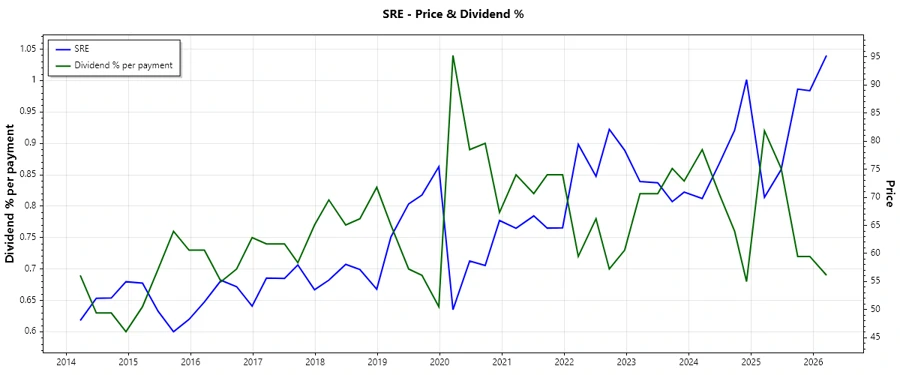
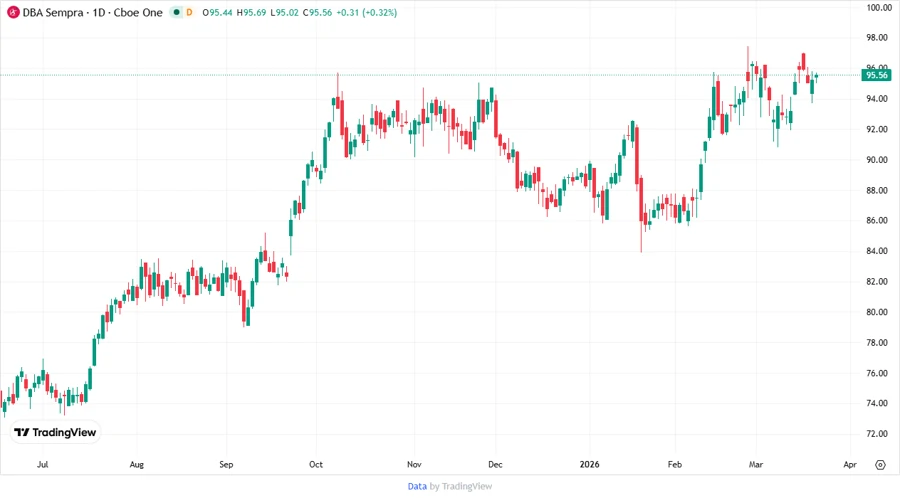
📊 Price Development
📋 Dividend Scoring System
| Criteria | Score | |
|---|---|---|
| Dividend yield | 3 | |
| Dividend stability | 5 | |
| Dividend growth | 3 | |
| Payout ratio | 2 | |
| Financial stability | 3 | |
| Dividend continuity | 5 | |
| Cashflow Coverage | 2 | |
| Balance Sheet Quality | 3 |
Total Score: 26/40
🗣️ Rating
Sempra exhibits a strong dividend history, ensuring consistent returns to shareholders. However, elevated payout ratios and cash flow challenges could hinder future dividend sustainability. Investors should remain cautious, giving equal weight to its proven dividend legacy and the current financial pressures, with strategic oversight needed to enhance liquidity and profitability.
Smart Data Insight
Master the Perfect Entry & Exit for this Stock
Don't leave your profits to chance. Historically, this stock follows specific seasonal patterns that institutional traders use to maximize returns.
- ✅ Identify the "Golden Buying Window"
- ✅ Avoid high-risk correction cycles
- ✅ Backtested data from the last 20+ years