January 18, 2026 a 03:31 am
SRE: Dividend Analysis - Sempra
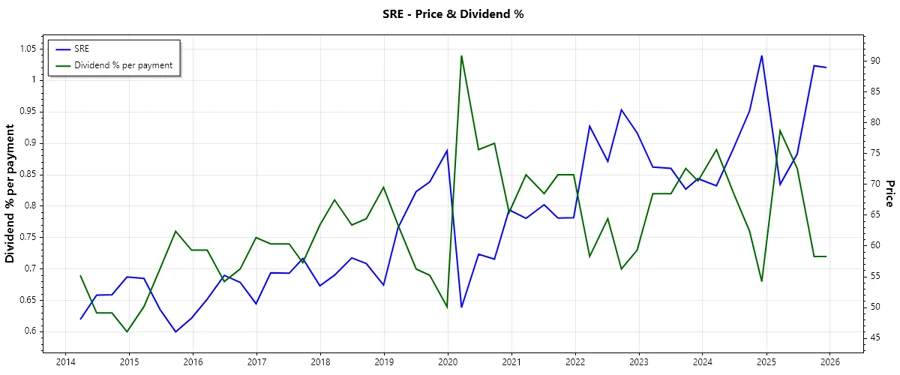
Sempra, a prominent utility company, demonstrates significant resilience through its robust dividend history, offering a dividend yield of 2.90%. With its stalwart presence in the market and consistent dividend record over 42 years without major cuts, Sempra stands as a reliable option for dividend-oriented investors despite market fluctuations. However, attention to payout ratios is crucial, especially given negative cash flow yields which may impact future payouts.
📊 Overview
The utilities sector, known for its stability, finds a solid representative in Sempra, offering consistent dividends. Evaluated through key performance indicators, Sempra presents a dividend yield of 2.89% and an impressive 42-year history of consistent dividend payments, highlighting its potential for income-focused portfolios.
| Metric | Value |
|---|---|
| Sector | Utilities |
| Dividend yield | 2.90% |
| Current dividend per share | 2.43 USD |
| Dividend history | 42 years |
| Last cut or suspension | 2000 |
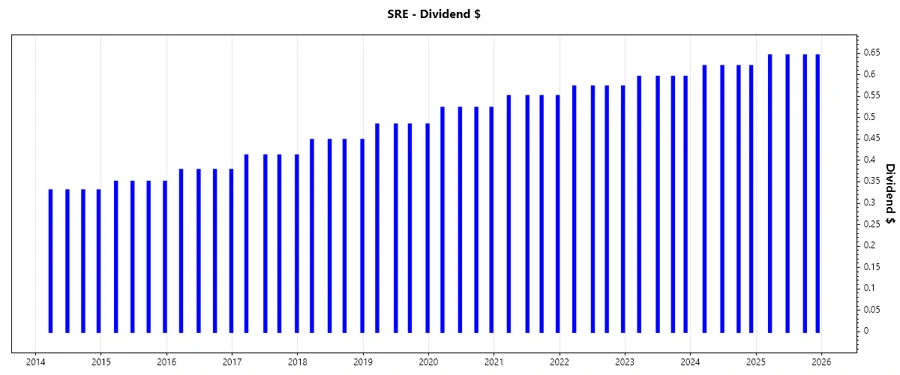
🗣️ Dividend History
With a potent history of unyielding dividend distribution, Sempra ensures investor confidence. This stability is crucial, especially in volatile markets, providing a source of steady income for stakeholders.
| Year | Dividend Per Share (USD) |
|---|---|
| 2025 | 2.58 |
| 2024 | 2.48 |
| 2023 | 2.38 |
| 2022 | 2.29 |
| 2021 | 2.20 |
📈 Dividend Growth
Sempra exhibits moderate but persistent growth in dividend payouts, showcasing an average growth rate of 4.30% over a five-year span. Tracking both three-year and five-year growth rates enables insight into the company's operational health and its capacity to increase shareholder returns.
| Time | Growth |
|---|---|
| 3 years | 4.05% |
| 5 years | 4.30% |
The average dividend growth is 4.30% over 5 years. This shows moderate but steady dividend growth.
📉 Payout Ratio
The payout ratio is a critical indicator of sustainability. Sempra's EPS-based payout ratio stands at 73.56%, within a sustainable level, considering the company's long-term stability. However, the FCF-based payout ratio indicates a red flag with negative coverage, alerting potential constraints in financing dividends through cash flows.
| Key figure ratio | Value |
|---|---|
| EPS-based | 73.56% |
| Free cash flow-based | -32.36% |
The EPS payout ratio of 73.56% is reasonable, reflecting cost control. However, the negative FCF ratio of -32.36% signals potential financial instability.
✅ Cashflow & Capital Efficiency
Understanding Sempra's cash flow ratios and capital utilization is key to assessing financial efficiency. The metrics point towards certain weaknesses in cash generation and stock compensation costs, pointing at efficiency improvements as a critical success factor.
| Metric | 2024 | 2023 | 2022 |
|---|---|---|---|
| Free Cash Flow Yield | -5.95% | -4.63% | -8.65% |
| Earnings Yield | 5.15% | 6.53% | 4.39% |
| CAPEX to Operating Cash Flow | 167.41% | 135.04% | 469.09% |
| Stock-based Compensation to Revenue | 0.66% | 0.51% | 0.46% |
| Free Cash Flow / Operating Cash Flow Ratio | -67.41% | -35.04% | -369.09% |
The numbers highlight Sempra's challenges in cash efficiency, with negative cash flow yields indicating over-leverage. The earnings yield shows stronger profitability potential.
⚠️ Balance Sheet & Leverage Analysis
An analysis of Sempra's financial leverage underscores its exposure to borrowing for capital projects. The debt-to-equity ratio reflects high leverage, suggesting a strategic focus on liability management is beneficial.
| Metric | 2024 | 2023 | 2022 |
|---|---|---|---|
| Debt-to-Equity | 114.74% | 108.30% | 106.57% |
| Debt-to-Assets | 37.28% | 35.65% | 36.80% |
| Debt-to-Capital | 53.43% | 52.00% | 51.59% |
| Net Debt to EBITDA | 5.86 | 5.04 | 6.46 |
| Current Ratio | 0.54 | 0.54 | 0.60 |
| Quick Ratio | 0.49 | 0.49 | 0.56 |
| Financial Leverage | 3.08 | 3.04 | 2.90 |
Sempra's financial stability is complicated by high leverage, signaled by debt ratios. The company’s strategic management of debt is essential to maintain liquidity.
📊 Fundamental Strength & Profitability
Sempra's strong return on equity indicates efficient profit generation, while its margins outline competitive advantages. Monitoring profitability relative to industry norms helps evaluate Sempra's resilient performance.
| Metric | 2024 | 2023 | 2022 |
|---|---|---|---|
| Return on Equity | 9.16% | 10.72% | 7.88% |
| Return on Assets | 2.98% | 3.53% | 2.72% |
| Net Margin | 22.09% | 19.46% | 13.75% |
| EBIT Margin | 26.34% | 24.61% | 15.42% |
| EBITDA Margin | 45.15% | 38.70% | 28.40% |
| Gross Margin | 27.20% | 23.71% | 26.75% |
| R&D to Revenue | 0% | 0% | 0% |
Sempra maintains profitable operations and robust shareholder returns, underscoring operational efficiency. These ratios reflect the firm's prudent financial management.
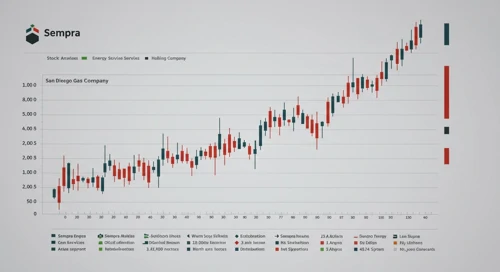
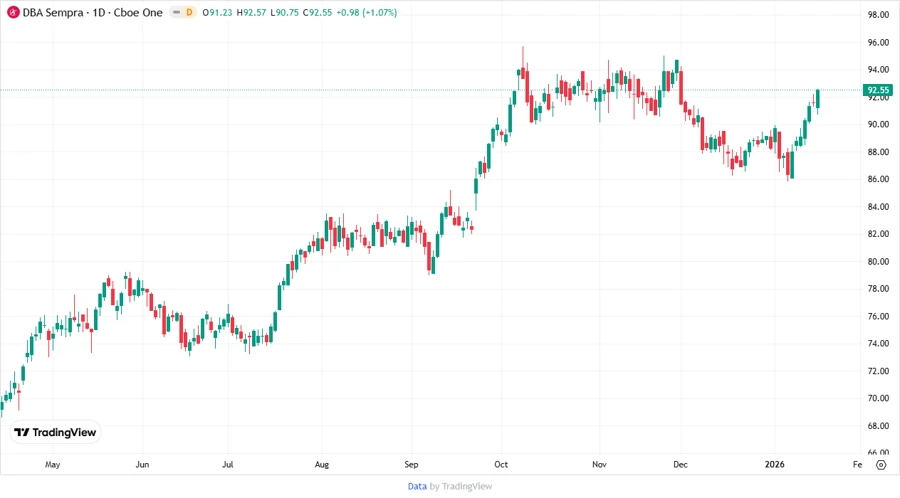
⚖️ Price Development
🔍 Dividend Scoring System
| Category | Score | Visual |
|---|---|---|
| Dividend yield | 3 | |
| Dividend Stability | 4 | |
| Dividend growth | 4 | |
| Payout ratio | 2 | |
| Financial stability | 3 | |
| Dividend continuity | 4 | |
| Cashflow Coverage | 2 | |
| Balance Sheet Quality | 3 |
Total Score: 25/40
🧾 Rating
In conclusion, Sempra delivers dependable dividends and showcases solid operational integrity. However, caution is advised due to its negative cash flow payout and debt exposure. The company remains a worthwhile consideration for income investors who prioritize consistency and are comfortable with moderate financial risks.