September 24, 2025 a 08:15 am

SPG: Trend and Support & Resistance Analysis - Simon Property Group, Inc.
Simon Property Group, Inc. (SPG) operates as a leading real estate investment trust (REIT) that provides premier shopping, dining, and entertainment destinations globally. Despite recent market volatilities, SPG displays resilience with strong asset management and strategic growth prospects. However, the stock's recent fluctuations necessitate a careful technical analysis to assess potential investment strategies.
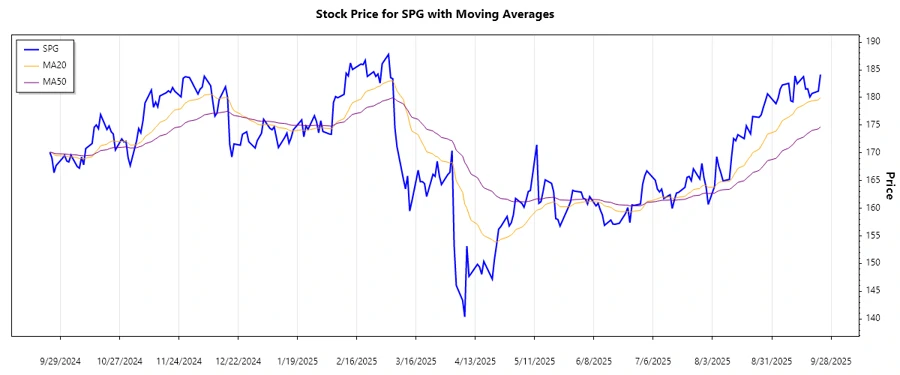
Trend Analysis
A detailed examination of the daily closing price data for Simon Property Group reveals the movement of the EMA20 relative to the EMA50. Over recent months, there have been notable price fluctuations that establish a trend pattern. The EMA calculations show:
| Date | Closing Price | Trend |
|---|---|---|
| 2025-09-23 | 184.13 | ▲ Uptrend |
| 2025-09-22 | 181.14 | ▲ Uptrend |
| 2025-09-19 | 180.72 | ⚖️ Sideways |
| 2025-09-18 | 180.09 | ▼ Downtrend |
| 2025-09-17 | 181.56 | ▲ Uptrend |
| 2025-09-16 | 181.52 | ▲ Uptrend |
| 2025-09-15 | 183.76 | ▲ Uptrend |
Over the past week, SPG has exhibited a predominantly upward trend as the EMA20 was consistently above the EMA50, indicating bullish momentum. This suggests positive short-term investor sentiment.
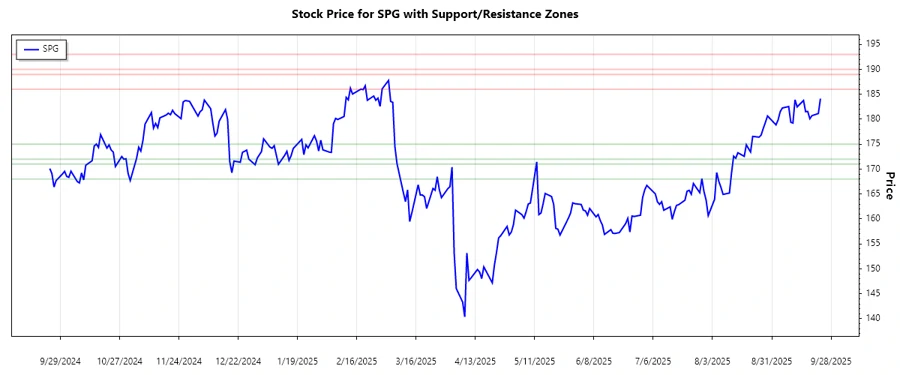
Support and Resistance
A closer evaluation of the closing prices determines key support and resistance levels, enabling traders to plan entry and exit strategies. The calculated zones are:
| Zone | From | To |
|---|---|---|
| Support Zone 1 | 172.00 | 175.00 |
| Support Zone 2 | 168.00 | 171.00 |
| Resistance Zone 1 | 186.00 | 189.00 |
| Resistance Zone 2 | 190.00 | 193.00 |
The current price level is approaching the specified resistance zones, which might impede further upward movement without strong bullish catalysts. A break above these zones could signal a potential bullish rally.
Conclusion
Simon's robust trend over recent periods positions it as an attractive option within the real estate sector, emphasizing strong investor support. Nevertheless, its oscillation below resistance levels necessitates cautious optimism. While potential price rallies might unfold, investors should watch for any breaches of key support levels, as they might catalyze a bearish reversal.
Smart Data Insight
Master the Perfect Entry & Exit for this Stock
Don't leave your profits to chance. Historically, this stock follows specific seasonal patterns that institutional traders use to maximize returns.
- ✅ Identify the "Golden Buying Window"
- ✅ Avoid high-risk correction cycles
- ✅ Backtested data from the last 20+ years