July 30, 2025 a 03:15 pm
SPG: Fibonacci Analysis - Simon Property Group, Inc.
Simon Property Group, Inc. (NYSE: SPG) has shown resilience despite the fluctuating market dynamics in the real estate sector. With its vast portfolio of premier shopping and entertainment destinations, SPG continues to attract significant foot traffic and retail sales. However, challenges due to an evolving retail environment and global economic pressures are critical factors to watch.
Fibonacci Analysis
| Detail | Value |
|---|---|
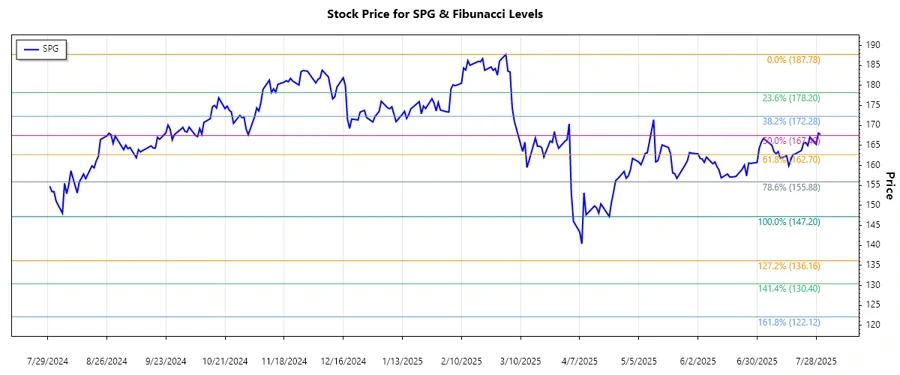
| Start Date | 2025-03-03 |
| End Date | 2025-07-30 |
| High Price | $187.78 on 2025-03-03 |
| Low Price | $147.2 on 2025-04-21 |
| Fibonacci Level 0.236 | $156.48 |
| Fibonacci Level 0.382 | $160.92 |
| Fibonacci Level 0.5 | $165.49 |
| Fibonacci Level 0.618 | $170.06 |
| Fibonacci Level 0.786 | $176.37 |
| Current Price | $167.79 |
| Retracement Zone | 0.5 |
| Technical Interpretation | The current price is at the 0.5 Fibonacci retracement level, indicating a potential support area where price consolidation might occur before a possible bullish continuation or bearish reversal. |
Conclusion
The SPG stock has been demonstrating a recovery from its lows reached in April 2025, approaching several critical resistance levels dictated by the Fibonacci retracement. The midpoint Fibonacci level suggests current consolidation, offering a chance for accumulation by bullish investors. However, persistent market uncertainties could result in volatility, challenging sustained uptrends. Analysts should focus on upcoming retail market trends and macroeconomic factors impacting consumer spending for projecting SPG's future trajectory.
Smart Data Insight
Master the Perfect Entry & Exit for this Stock
Don't leave your profits to chance. Historically, this stock follows specific seasonal patterns that institutional traders use to maximize returns.
- ✅ Identify the "Golden Buying Window"
- ✅ Avoid high-risk correction cycles
- ✅ Backtested data from the last 20+ years